

Newsroom
Sorted by: Latest
-
emeis : Résultats semestriels 2026
PUTEAUX, France--(BUSINESS WIRE)--Regulatory News: emeis (Paris:EMEIS): Une activité dynamique sur tous les marchés du Groupe Chiffre d’affaires en forte hausse de +6,0% à périmètre constant, soit une hausse de +103 M€ … notamment sur les Maisons de Retraite à +7,1% (cliniques à +4,1%) et à l’international à +7,5% (France à +3,7%) Hausse des taux d’occupation de +2,8 pts en moyenne sur un an (à 89,8%) et qui dépasse 90% sur le seul deuxième trimestre, avec l’amélioration des performances commer...
-
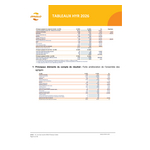
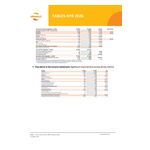
emeis: 2026 Half-Year Results
PUTEAUX, France--(BUSINESS WIRE)--Regulatory News: emeis (Paris:EMEIS): Strong performance across all of the Group’s markets Revenue rose sharply by +6.0% on a like-for-like basis, representing an increase of +€103 million … particularly in Nursing Homes at +7.1% (clinics at +4.1%) and internationally at +7.5% (France at +3.7%) Occupancy rates rose by an average of +2.8 points (to 89.8%) and exceeded 90% in the second quarter alone, driven by improved sales performance (a +22% increase in the n...
-
Corvias Passes Halfway Point on Landmark $210 Million Military Housing Modernization Program
WARWICK, R.I.--(BUSINESS WIRE)--Corvias today announced it has surpassed the halfway mark on Project Homestead, a landmark $210 million modernization initiative transforming homes for thousands of military families at Fort Bragg, N.C., Fort Meade, Md., and Fort Rucker, Ala. With 1,215 of 2,388 home renovations delivered ahead of schedule, overall completion stands at 51 percent. Launched in partnership with the U.S. Army, Project Homestead reflects Corvias’ continued commitment to advancing qua...

-
Hims & Hers Responds to FTC Lawsuit
SAN FRANCISCO--(BUSINESS WIRE)--Hims & Hers Health, Inc. (NYSE: HIMS) responded to the lawsuit filed today by the Federal Trade Commission (FTC): This lawsuit disregards substantial evidence we provided the FTC during its nearly three-year investigation, ignores established state laws and industry standards in telehealth, and contorts the law to try to manufacture claims. This is not enforcement grounded in consumer protection; it is an effort to generate headlines at our expense. We are co...
-
Hanwha Energy USA Subsidiary Expands Retail Electricity Business in PJM
HOUSTON--(BUSINESS WIRE)--174 Power Global Retail Corporation, a wholly owned subsidiary of Hanwha Energy USA Holdings Corporation, today announced its entry into competitive retail electricity markets within the PJM region. 174 Power Global Retail Corporation, which operates Chariot Energy and Pumpjack Power in Texas, has acquired Powervine Energy, LLC and Powervine Energy MD, LLC. Subject to applicable state licensing and regulatory requirements, the company will market and sell retail electr...
-
RDi USA Inc. Launches at ADLM 2026, Bringing Automated Diagnostic Kitting and Connected Self-Sampling Pathways to the U.S.
ANAHEIM, Calif.--(BUSINESS WIRE)--RDi today announced the launch of RDi USA Inc. at the ADLM 2026 Clinical Lab Expo, where the new U.S. business will make its official industry debut at Booth #4454 from July 28–30. RDi USA has been created to help laboratories, diagnostic manufacturers, healthcare providers, screening organizations and research partners overcome one of the largest barriers to scaling diagnostic testing: the fragmented infrastructure surrounding the test itself, for partners ope...
-
Amaterra Winery Named Nation's Best Winery Restaurant by USA TODAY 10Best
PORTLAND, Ore.--(BUSINESS WIRE)--Amaterra Winery has been named the Best Winery Restaurant in USA TODAY 10Best’s 2026 Readers' Choice Awards, earning the No. 1 spot among winery restaurants across the United States. The national recognition celebrates the Portland winery's chef-driven dining program, estate-grown wines and elevated guest experience. The USA TODAY 10Best Readers' Choice Awards recognize outstanding travel, dining and hospitality destinations, with nominees selected by industry e...
-
Acumentrics Achieves CMMC Level 2 Certification Following Successful Third-Party Assessment
WALPOLE, Mass.--(BUSINESS WIRE)--Acumentrics, a leading provider of rugged, mission-critical power solutions for defense and industrial applications, today announced that it has successfully passed a third-party assessment and achieved Cybersecurity Maturity Model Certification (CMMC) Level 2. The certification confirms that Acumentrics meets the U.S. Department of Defense (DoD) standards for protecting Controlled Unclassified Information (CUI) across its systems and operations.The assessment wa...
-
Good Neighbor Pharmacy® Named #1 in Customer Satisfaction with Chain Drug Store Pharmacies and Most Trusted by JD Power
CONSHOHOCKEN, Pa.--(BUSINESS WIRE)--Good Neighbor Pharmacy, a national franchise for independent pharmacies offered through Cencora, has been ranked “#1 in Customer Satisfaction with Chain Drug Store Pharmacies” in the JD Power 2026 U.S. Pharmacy StudySM, a syndicated benchmarking study profiling the experiences of customers of the largest pharmacies in the United States. In addition to ranking highest overall, Good Neighbor Pharmacy ranked highest across four of seven dimensions: Pharmacy offe...

-
CHAOS Industries Acquires Atropos Group, Uniting Sensing and Effects with Autonomous Airborne Platforms
LOS ANGELES & WASHINGTON--(BUSINESS WIRE)--CHAOS Industries, a defense-tech company that designs and manufactures advanced radar, sensor, effector, and network systems on U.S. soil, today announced the acquisition of Atropos Group, an aerospace company developing autonomous air platforms. CHAOS' counter-drone radar and sensing systems are in production at U.S. facilities and deployed to protect critical infrastructure, both domestically and with global partners in the Middle East. The Atropos a...