ICAPE - Q3 2026 Revenue of €68.7 Million: +36.4% Year-on-year and +34.2% Organically at Constant Exchange Rates
ICAPE - Q3 2026 Revenue of €68.7 Million: +36.4% Year-on-year and +34.2% Organically at Constant Exchange Rates
Record order backlog of USD152.9 million at October 31, 2026 (+138% yoy)
- Q3 2026 revenue of €68.7 million, up +36.4% versus Q3 20251 (+34.2% organically at constant exchange rates) and up +11.1% versus Q2 2026 – third consecutive quarter of accelerating growth
- 9M 2026 revenue of €182.0 million, up +20.5% versus 9M 2025 and up +23.5% organically at constant exchange rates
- New all-time high order backlog: USD136 million at September 30, 2026 (+136.6% yoy and +45.3% vs. June 30, 2026), then USD152.9 million at October 31, 2026 (+138% yoy)
- Confirmation of the 2026 targets: consolidated annual revenue growth of at least +18% and EBIT margin of around 6%
- Capital Markets Day on November 24, 2026: presentation of the new medium-term operational, strategic and financial targets
FONTENAY-AUX-ROSES, France--(BUSINESS WIRE)--Regulatory News:
The ICAPE Group (ISIN code: FR001400A3Q3 – ticker symbol: ALICA), a global technology distributor of printed circuit boards (“PCBs”) and custom electronic parts, announces today its revenue for the 3rd quarter and first nine months of 2026.
Yann DUIGOU, ICAPE Group CEO, stated:
“The third quarter of 2026 marks a further acceleration in our growth, at +36.4% after +22.9% in the second quarter, in a market still driven by AI-related demand and marked by supply chain tensions. Once again, our teams were able to execute ever-larger orders for our customers, who are facing increasing pressure across all their markets. The quality of our response enabled us to lift our order backlog to a new record of USD152.9 million as of October 31, 2026, up +138% compared to October 31, 2025.
We expect these tensions to continue at least until the first quarter of 2027. We are also continuing our cost discipline and operational efficiency measures, driven in part by the deployment of AI and the Group’s legal simplification. On the strength of +20.5% growth over nine months, we therefore remain fully confident in our ability to meet our 2026 targets.”
Financial information for the third quarter and first nine months of 2026
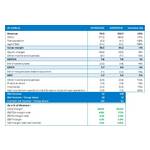
Consolidated revenue (in €m)
Revenue (€m) |
20251 |
2026 |
Yoy variation |
Organic variation2 |
Organic variation at constant currency |
Q1 |
50.4 |
51.5 |
+2.2% |
+2.1% |
+10.6% |
Q2 |
50.3 |
61.8 |
+22.9% |
+22.6% |
+25.0% |
Q3 |
50.3 |
68.7 |
+36.4% |
+35.7% |
+34.2% |
9M |
151.0 |
182.0 |
+20.5% |
+20.1% |
+23.5% |
Analysis of Q3 2026 activity
Consolidated quarterly revenue (in €m)
|
Yoy evolution (Q3 2026 vs Q3 2025) |
Sequential evolution (Q3 2026 vs Q2 2026) |
||||||
Q3 2025 |
Q2 2026 |
Q3 2026 |
Variation |
Organic |
Organic at
|
Variation |
Organic |
Organic at
|
50.3 |
61.8 |
68.7 |
+36.4% |
+35.7% |
+34.2% |
+11.1% |
+10.4% |
+9.5% |
Q3 2026 revenue analysis
Revenue for the third quarter of 2026 stood at €68.7 million, up +36.4% on a reported basis compared to Q3 2025. This is the third consecutive quarter of accelerating growth, following +2.2% in Q1 2026 and +22.9% in Q2 2026.
Organic growth was +35.7% versus Q3 2025, with external growth contributing 0.7 points. For the first time this year, the EUR/USD exchange rate effect was favorable (EUR/USD at 1.15 in Q3 2026 vs. 1.17 in Q3 2025): at constant exchange rates, organic growth thus came to +34.2%.
On a sequential basis, Q3 2026 revenue rose by +11.1% compared to Q2 2026, by +10.4% organically and by +9.5% organically at constant exchange rates (EUR/USD at 1.16 in Q2 2026).
Growth in the third quarter was driven mainly by the price effect and, to a lesser extent, by higher volumes, against a backdrop of supply tensions linked to AI-driven demand.
In terms of size, the PCB Asia (29% of revenue), PCB Southern Europe (23%) and CIPEM (17%) segments generated 69% of revenue for the quarter.
In terms of growth, PCB Asia (+45%) accounted for one third of the quarter’s increase, followed by PCB Southern Europe (+36%, 23% of the increase), driven by ICAPE France and ICAPE Italia, and PCB Americas (+73%, 17% of the increase), driven by ICAPE USA. All PCB segments grew by more than 30%, while CIPEM grew by +13.9%, with no significant price effect.
Quarterly order backlog
|
Yoy evolution (Q3 2026 vs Q3 2025) |
Sequential evolution (Q3 2026 vs Q2 2026) |
||||||
Q3 2025 |
Q2 2026 |
Q3 2026 |
Variation |
Organic |
Organic at
|
Variation |
Organic |
Organic at
|
€48.8M |
€82.1M |
€119.8M |
+145.5% |
+143.4% |
+140.7% |
+45.8% |
+45.6% |
+44.5% |
USD57.5M |
USD93.6M |
USD136.0M |
+136.6% |
+134.7% |
NA |
+45.3% |
+45.2% |
NA |
The order backlog stood at €119.8 million at the end of September 2026, a new all-time high, up +145.5% (and +140.7% on an organic, constant-currency basis) compared to the end of September 2025. This represents a +45.8% increase versus the end of June 2026, and +44.5% on an organic, constant-currency basis.
In US dollars—a currency representing more than three-quarters of invoiced orders—the order backlog reached USD136.0 million at the end of September 2026, compared to USD57.5 million at the end of September 2025 and USD93.6 million at the end of June 2026, representing growth of +136.6% versus Q3 2025 and +45.3% versus Q2 2026, respectively. As of October 31, 2026, the order backlog stood at USD152.9 million (€136.9 million), up +138.0% compared to October 31, 2025 (USD64.3 million) and +146.2% in euros.
The sharp rise in the order backlog in Q3, driven in particular by OEM customers, reflects an increase in average order size and a stronger price effect, which accounts for around 75% of the increase. Order processing lead times also continued to lengthen.
Achieved in a high-pressure environment, this performance reflects the teams’ commitment to customers and suppliers, as well as the reliability of the Group’s tools, processes and supply chain: strengths that are difficult to replicate without the experience, expertise and local presence of an integrated player such as ICAPE.
In terms of size, the PCB Southern Europe (25% of the backlog), PCB Asia and rest of the world (22%) and PCB Central Europe (17%) segments accounted for 64% of the order backlog at the end of September 2026.
In terms of growth, PCB Central Europe (+126%) accounted for 31% of the quarter’s increase, followed by PCB Southern Europe (+49%, 26% of the increase) and PCB Asia (+55%, 24% of the increase). The CIPEM backlog was broadly stable over the quarter, and PCB accounts for 83% of the backlog.
Analysis of activity for the first nine months of 2026
Consolidated cumulative revenue (in €m)
|
Yoy evolution (9M 2026 vs 9M 2025) |
Sequential evolution (9M 2026 vs April–December 2025) |
||||||
9M 2025 |
Apr.–Dec. 20253 |
9M 2026 |
Variation |
Organic |
Organic at
|
Variation |
Organic |
Organic at
|
151.0 |
149.9 |
182.0 |
+20.5% |
+20.1% |
+23.5% |
+21.4% |
+20.8% |
+21.3% |
9M 2026 revenue analysis
As of September 30, 2026, Group revenue for the first nine months of the year amounted to €182.0 million, up +20.5% on a reported basis compared to the first nine months of 2025, driven by the acceleration in the second and third quarters.
Organic growth stood at +20.1%, and at +23.5% at constant exchange rates, as the currency effect remained unfavorable on a cumulative basis over the period (EUR/USD at 1.16 in 9M 2026 vs. 1.12 in 9M 2025), despite the reversal observed in Q3.
On a sequential basis, revenue for the first nine months of 2026 rose by +21.4% compared to the previous nine months (April to December 2025, i.e. €149.9 million), by +20.8% organically and by +21.3% organically at constant exchange rates, with a limited currency effect between the two periods (EUR/USD at 1.16 vs. 1.15).
Growth over the first nine months was driven mainly by the price effect, which has accelerated since Q2, and to a lesser extent by volumes, which strengthened quarter after quarter, against a backdrop of supply tensions linked to AI-driven demand. In terms of size, the PCB Asia (28% of revenue), PCB Southern Europe (24%) and CIPEM (17%) segments generated 69% of revenue for the first nine months. In terms of growth, PCB Southern Europe (+24.7%, 28% of the increase), PCB Asia (+16.0%, 22%) and PCB Americas (+50.9%, 18%) together accounted for nearly 70% of the increase, with PCB Americas posting the strongest growth.
Continuation of the strategy and confirmation of the raised 2026 targets
During the third quarter of 2026, the Group continued to roll out its AI-driven automation initiatives, while continuing its cost discipline and the improvement of its operating leverage. The market continues to face an unprecedented environment of rising production costs and supply chain pressures, driven by the global acceleration in AI-related equipment and infrastructure. ICAPE expects these pressures to continue at least until the first quarter of 2027.
Industry analysts4 have raised their forecasts for the PCB market’s 2025–2030 average annual growth rate, from +7.7% in March 2026 to +11% in July, then to +13.6%. On the basis of these observations, ICAPE’s Board of Directors raised the 2026 annual revenue growth target on September 30, 2026, while maintaining the EBIT margin target. The figures published and information available as of the date of this press release support these targets:
- revenue growth of +20.5% on a reported basis and +20.1% organically in 9M 2026, including +36.4% and +35.7% respectively in Q3 2026,
- record order backlog of USD136.0 million at the end of September 2026 (USD152.9 million as of October 31, 2026), up +136.6% versus the end of September 2025 and +45.3% versus the end of June 2026,
- industry experts’ estimate of the PCB market’s 2025–2030 average annual growth rate raised to +13.6%.
ICAPE therefore confirms all its 2026 annual targets, as raised by the Board of Directors on September 30, 2026:
- growth in consolidated annual revenue for 2026 of at least +18% (compared to the initial +12%):
- organic revenue growth of around +18% (compared to the initial +6% to +8% range), assuming no further currency deterioration5
- generation of approximately €5 million in additional revenue through external growth by the end of 2026 (compared to the €28 million previously targeted), due to the failure to complete in July a transaction that had been underway since the beginning of the year
- 2026 EBIT margin of around 6%, factoring in sales performance, the impact of cost-reduction plans, synergies from acquisitions, and the effects of the phased closure of loss-making sites and the progressive implementation of the new IT tool.
ICAPE Group will present its new medium-term operational, strategic and financial targets at its Capital Markets Day on November 24, 2026.
***
APPENDICES
1. Highlights of the third quarter of 2026
JULY
On July 1, 2026, the Group transferred the assets and liabilities of NTW HK to ICAPE Hong Kong, both wholly owned by ICAPE Holding.
On July 2, 2026, ICAPE paid the cash dividend of €0.09 per share for the 2025 financial year, approved by the General Meeting of May 20, 2026.
In July 2026, an external growth transaction that had been underway since the beginning of the year could not be completed.
On July 29, 2026, ICAPE released its revenue for the second quarter and first half of 2026, up +22.9% and +12.5% respectively, together with a record order backlog of USD93.6 million at the end of June 2026.
SEPTEMBER
On September 1, 2026, ICAPE Japan was merged into NTW Inc, both wholly owned by ICAPE Holding. These transactions, like the one carried out on July 1, aim to rationalize and simplify the Group’s legal structure.
On September 30, 2026, ICAPE’s Board of Directors approved the 2026 half-year financial statements and decided to raise the 2026 consolidated annual revenue growth target to at least +18% (vs. +12% previously), while confirming the EBIT margin target of around 6%.
SUBSEQUENT EVENTS
On October 1st, 2026, ICAPE released its first-half 2026 results: revenue of €113.3 million (+12.5%, including +18% organic growth excluding currency effects), EBIT margin of 4.1% (including 6% in Q2 2026), net income – Group share of €1.6 million (vs. €1.1 million in H1 2025), recurring net income – Group share of €3 million and net financial debt of €27.6 million (vs. €28.8 million at December 31, 2025).
Following the sale in June 2026 of a block of shares to the Farringdon fund, which has recently further increased its position, Mr. Thierry Ballenghien, Chairman and Founder of ICAPE, was approached in October by two new, separate European funds seeking to acquire a total of 77,433 shares from him in blocks. These transactions will also help improve the liquidity of the share capital.
As of October 30, 2026, ICAPE had repurchased a total of 2.75% of its share capital under the share buyback program.
2. Average exchange rate
|
Q3 2025 |
9M 2025 |
Q2 2026 |
Q3 2026 |
9M 2026 |
US Dollar (EUR/USD) |
1.1681 |
1.1188 |
1.1629 |
1.1505 |
1.1610 |
3. Upcoming financial releases:
- Capital Markets Day presenting ICAPE’s new medium-term operational, strategic and financial targets, Tuesday, November 24, 2026
- Full-year 2026 revenue, Thursday, February 11, 2027
- Full-year 2026 results, Thursday, March 25, 2027
- Q1 2027 revenue, Wednesday, May 5, 2027
- 2027 General Meeting, Wednesday, May 19, 2027
- Q2 2027 revenue, Thursday, July 29, 2027
- H1 2027 results, Thursday, September 30, 2027
- Q3 2027 revenue, Wednesday, November 10, 2027
Disclaimer
The objectives and trends presented in this press release are based on data, assumptions, and estimates, particularly regarding economic prospects, that the Group considers reasonable as of the date of this press release. These future prospects and objectives, resulting from the Group’s strategic direction, do not constitute forecasts or estimates of the Group’s earnings. The figures, data, assumptions, estimates, and objectives presented are subject to change or modification in unpredictable ways, depending, among other things, on developments in the economic, financial, competitive, legal, regulatory, accounting, and tax environment, or on other factors beyond the Group’s knowledge as of the date of this press release. Furthermore, the materialization of certain risks described in Chapter 3 (Risk Factors) of the Registration Document and Chapter 2 (Risk Factors) of the Securities Note, as updated in Section 6 of the “Management Report” chapter of the 2025 Annual Financial Report, available at www.icape-group.com, could adversely affect the Group’s business, financial condition, market conditions, results of operations, or outlook, and consequently call into question its ability to achieve the objectives presented herein. Moreover, the achievement of these objectives depends on the success of the Group’s strategy and its implementation. Therefore, the Group makes no commitment and provides no guarantee regarding the achievement of the objectives set forth in this press release.
About the ICAPE Group
Founded in 1999, the ICAPE Group acts as a key technology expert in the supply chain for printed circuit boards and custom electronic parts. With a global platform comprised of 39 subsidiaries and a leading presence in China, where the vast majority of printed circuit boards are produced, the Group offers its customers a unique range of products and services (“one-stop-shop”). As of December 31, 2025, the ICAPE Group achieved consolidated revenue of €200.3 million.
Learn more at: icape-group.com
1 Compared to the data published on November 13, 2025 for Q3 and 9M 2025 (revenue of €50.8 million and €152.8 million respectively), the comparative information has been adjusted to reflect the application of IFRS 5 (discontinuation of the HMI and TRAX businesses).
2 Organic growth refers to revenue growth excluding external growth. Unless otherwise stated, it includes currency effects.
3 Nine-month period preceding the first nine months of 2026, i.e. from April 1 to December 31, 2025 (Q2, Q3 and Q4 2025), using the same method as the H1 2026 vs H2 2025 comparison; average EUR/USD exchange rate of 1.1549 over the period (average of quarterly rates).
4 Prismark Q2 2026 report.
5 At the exchange rates observed at the end of 2025.
Contacts
Group CFO
ICAPE Group
Arnaud Le Coguic
investor@icape-group.com
Head of Investor Relations & Financial Communication
ICAPE Group
Régine Gaggioli
regine.gaggioli@icape-group.com