TFS Financial Reports Record Profit of $100.7 Million in 2026
TFS Financial Reports Record Profit of $100.7 Million in 2026
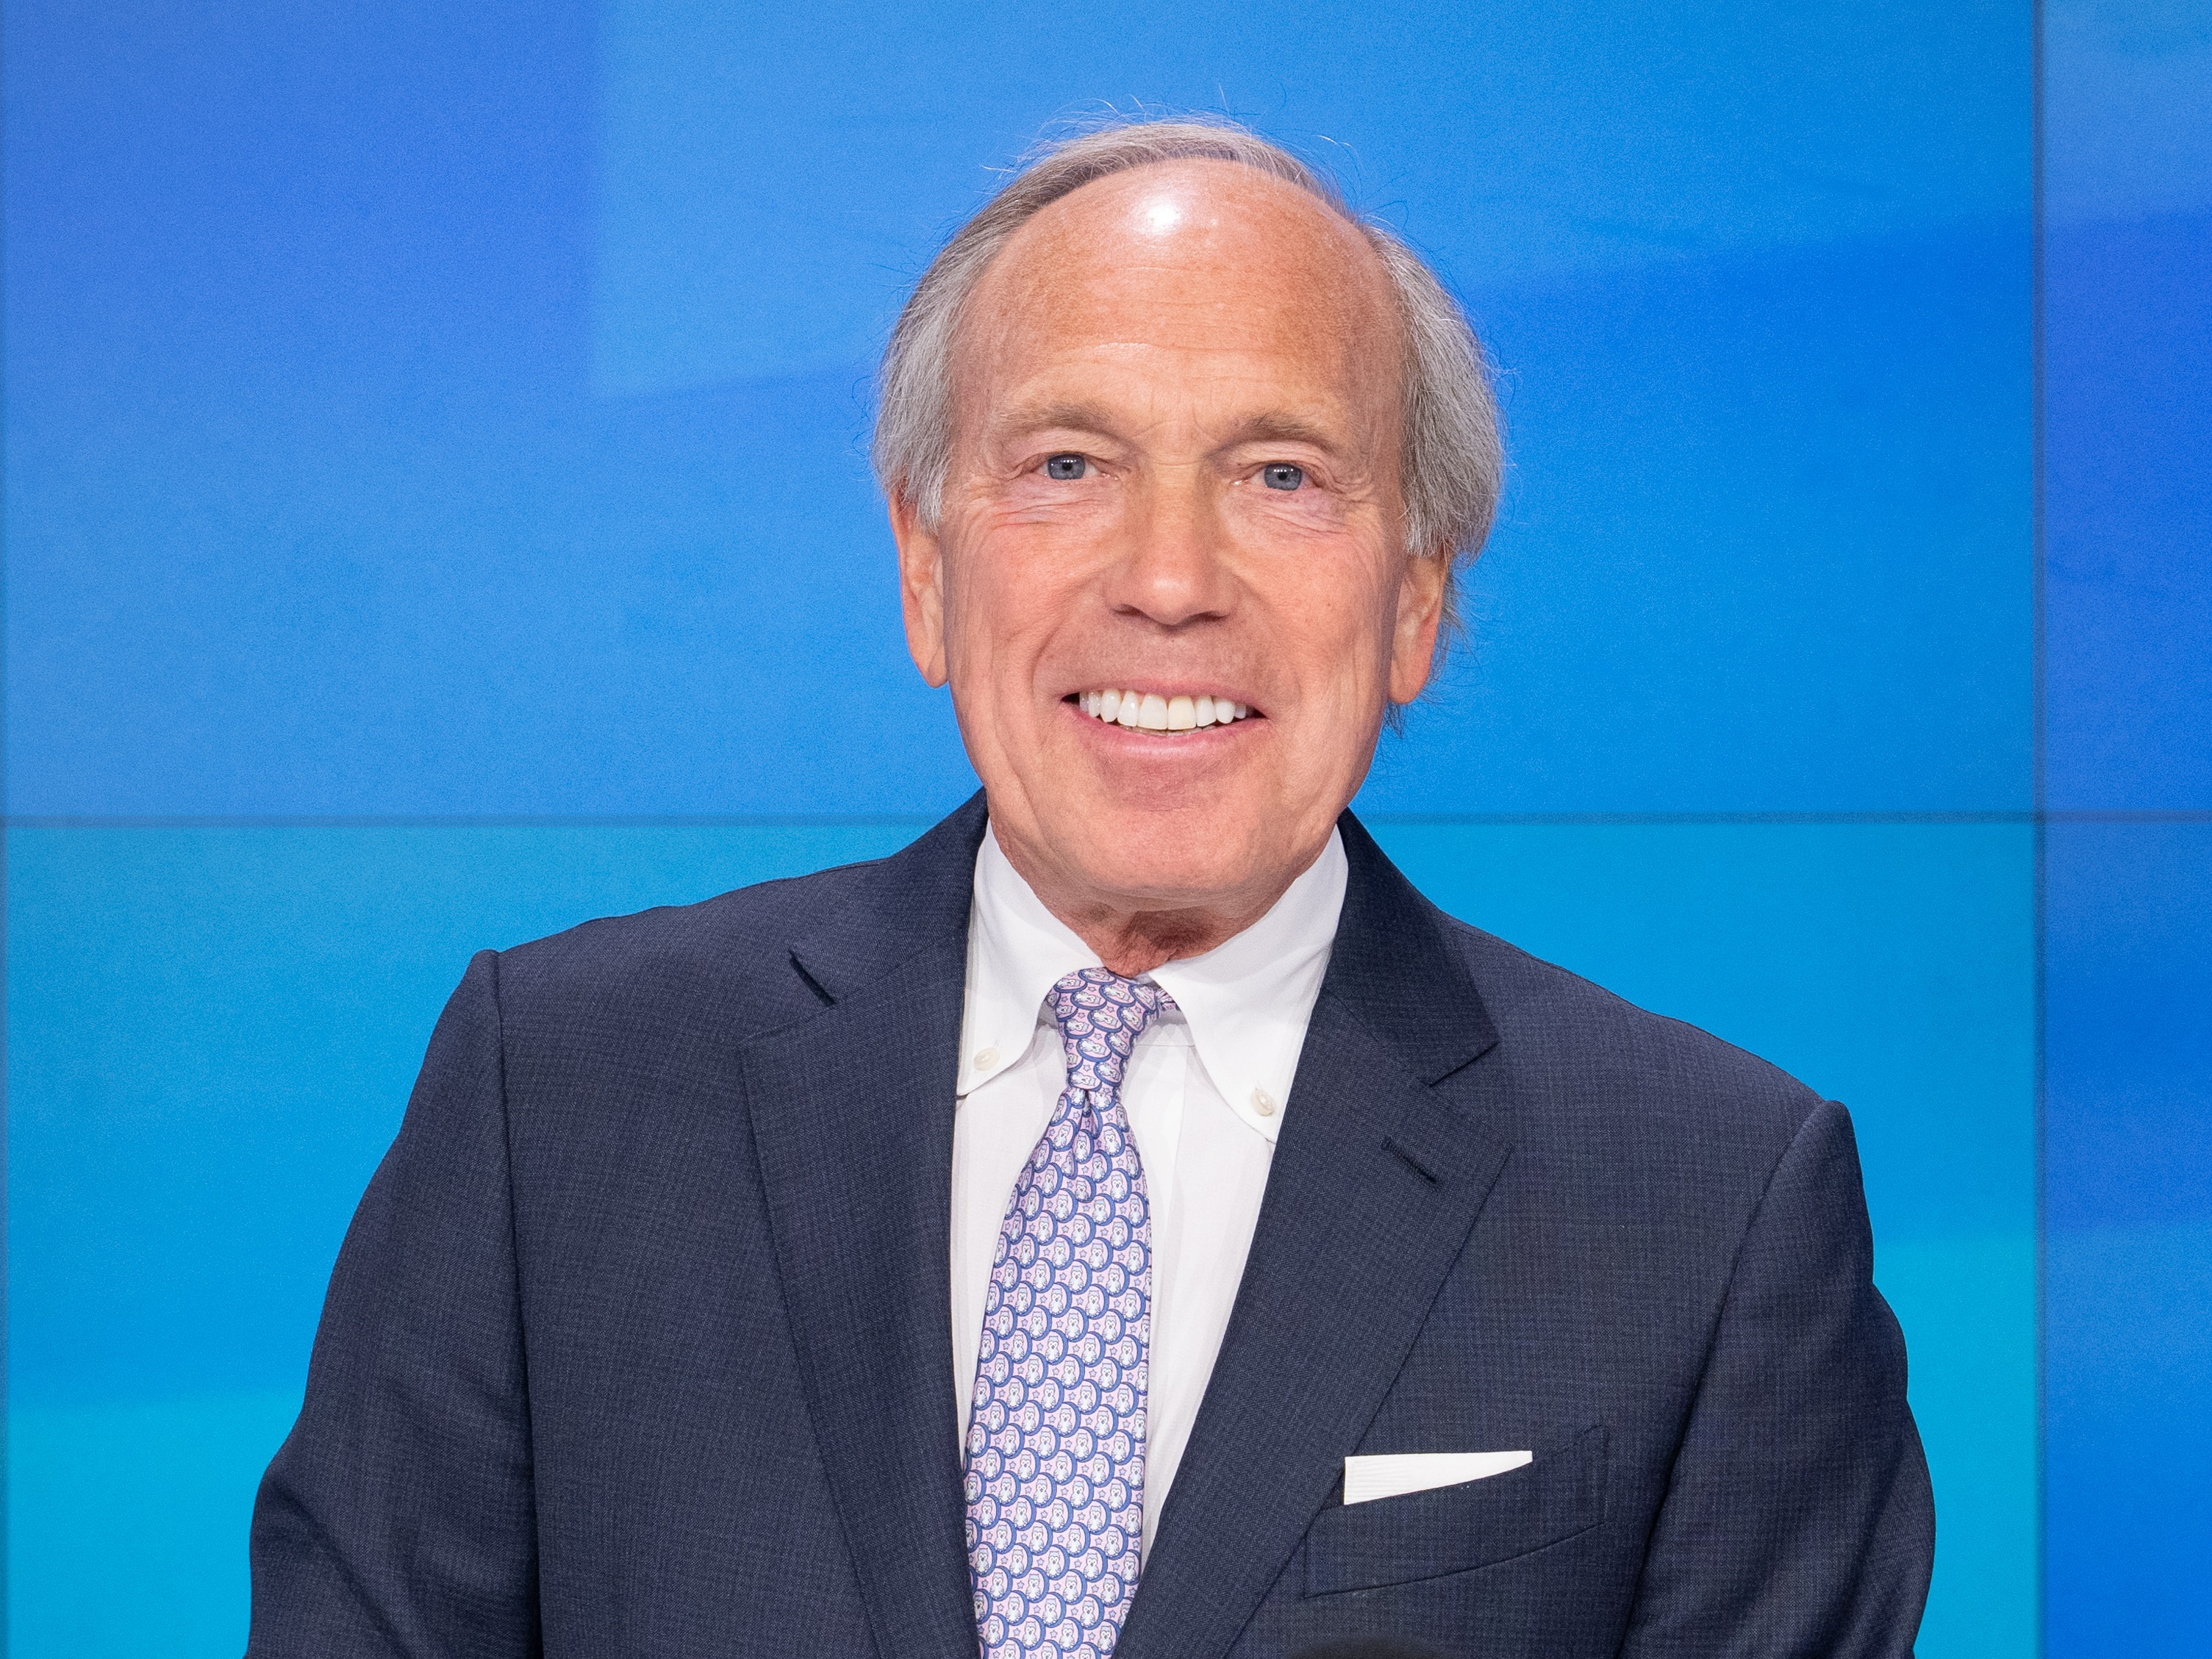
CLEVELAND--(BUSINESS WIRE)--TFS Financial Corporation (NASDAQ: TFSL) (the "Company", "we", "our"), the holding company for Third Federal Savings and Loan Association of Cleveland (the "Association"), announced net income of $100.7 million for the fiscal year ended September 30, 2026, an increase of $9.7 million, or 10.7%, compared to $91.0 million for the fiscal year ended September 30, 2025. Net income for the quarter ended September 30, 2026 was $24.7 million compared to $30.5 million for the quarter ended June 30, 2026, a decrease of $5.8 million, or 19.0%.
“This year was another milestone for Third Federal, passing $100 million in net income, driven by continued net margin improvement to 1.88%, and a 39% increase in mortgage loan originations from 2025,” said Chairman and CEO Marc A. Stefanski. “With the significant investment we made in a new core banking system and a strong Tier 1 capital leverage ratio of 10.53%, we are well-positioned to continue to grow and effectively serve our customers.”
Fiscal 2026 Results Compared with Fiscal 2025
Net income increased $9.7 million, or 10.7%, to $100.7 million for the fiscal year ended September 30, 2026 compared to net income of $91.0 million for fiscal 2025. The increase reflected $29.1 million of additional net interest income, a $5.0 million favorable change in the provision for credit losses and a $1.2 million increase in non-interest income, partially offset by a $21.1 million increase in non-interest expense.
Net interest income increased $29.1 million, or 9.9%, to $321.8 million for the fiscal year ended September 30, 2026 compared to $292.7 million for the fiscal year ended September 30, 2025. Total interest income increased $46.0 million to $809.2 million, driven by a $53.1 million increase in interest income on loans, partially offset by lower income from investment securities, other interest-earning assets and Federal Home Loan Bank ("FHLB") stock. The average balance of loans increased $529.5 million and the yield improved by 18 basis points. Total interest expense increased $17.0 million to $487.5 million. The interest rate spread was 1.57% for the fiscal year ended September 30, 2026 compared to 1.45% for the fiscal year ended September 30, 2025. The net interest margin was 1.88% for the fiscal year ended September 30, 2026 and 1.76% for the fiscal year ended September 30, 2025.
During the fiscal year ended September 30, 2026, there was a $2.5 million release of provision for credit losses compared to $2.5 million of provision expense during the fiscal year ended September 30, 2025. Net loan recoveries totaled $2.1 million for the fiscal year ended September 30, 2026 and $4.0 million for the prior fiscal year.
The total allowance for credit losses decreased $0.5 million to $103.9 million, or 0.63% of total loans receivable, at September 30, 2026 from $104.4 million, or 0.67% of total loans receivable, at September 30, 2025. The decrease was primarily related to reduced reserve requirements for longer term, fixed-rate home equity loans offset by an increase in reserve requirements due to loan growth. The allowance for credit losses included $28.5 million and $30.1 million in liabilities for unfunded commitments at September 30, 2026 and September 30, 2025, respectively.
Total loan delinquencies increased $26.0 million to $60.7 million, or 0.37% of total loans receivable, at September 30, 2026 from $34.7 million, or 0.22% of total loans receivable, at September 30, 2025. Delinquencies increased across all loan portfolios, most notably among loans less than 90 days past due, including increases of $8.4 million in residential mortgage loans, $15.1 million in home equity lines of credit and $2.7 million in home equity loans and continue to be monitored by management for any specific trend. Non-accrual loans totaled $49.8 million, or 0.30% of total loans receivable, at September 30, 2026, compared to $38.7 million, or 0.25% of total loans receivable, at September 30, 2025.
Total non-interest income increased $1.2 million, or 4.2%, to $30.0 million for the fiscal year ended September 30, 2026, from $28.8 million for the fiscal year ended September 30, 2025. The increase was primarily due to an increase of $1.3 million in loan fees and service charges.
Total non-interest expense increased $21.1 million, or 10.3%, to $225.4 million for the fiscal year ended September 30, 2026 from $204.3 million for the fiscal 2025. Salaries and employee benefits rose $11.3 million primarily due to higher staffing levels, increased stock-based compensation expense and a $2.2 million one-time bonus paid to associates in December 2025, partially offset by a $4.1 million increase in capitalized payroll costs related to the implementation of a new core banking system. Office property, equipment and software expenses increased $3.2 million due to higher technology costs. Other expenses rose $7.6 million, including a $4.6 million unfavorable change in pension (defined benefit) expense, increases of $1.1 million in postage, $1.0 million in credit report expense and $0.5 million in audit expense. A $0.3 million decrease in federal insurance premium and assessments partially offset the overall increase in expenses. The change in pension expense reflected $2.5 million of settlement expense recognized in the fourth quarter of fiscal 2026; the remainder was attributable to changes in actuarial assumptions. The pension plan was terminated in December 2025 and the remaining obligation is expected to settle during the quarter ending December 31, 2026
Financial Condition at September 30, 2026 vs. September 30, 2025
Total assets increased $735.1 million, or 4.2%, to $18.19 billion at September 30, 2026 from $17.46 billion at September 30, 2025. The increase was mainly the result of increases in cash and cash equivalents, FHLB stock and loans held for investment partially offset by decreases in investment securities available for sale and loans held for sale.
Cash and cash equivalents increased $23.7 million, or 5.5%, to $453.1 million at September 30, 2026 from $429.4 million at September 30, 2025, due to normal fluctuations and liquidity management.
Investment securities available for sale decreased $26.0 million, or 5.0%, to $494.6 million at September 30, 2026 from $520.7 million at September 30, 2025. The decrease was mainly due to the combined effect of cash flows from security repayments and maturities.
Loans held for investment, net of allowance and deferred loan expenses, increased $754.6 million, or 4.8%, to $16.42 billion at September 30, 2026 from $15.66 billion at September 30, 2025. Loans held for sale decreased $56.6 million to $1.1 million at September 30, 2026. Home equity loans and lines of credit increased $871.0 million to $5.68 billion and the residential core mortgage loan portfolio decreased $99.1 million to $10.70 billion.
The changes in loans held for sale and loans held for investment were affected by the volume of loans originated, acquired and sold. During the fiscal year ended September 30, 2026, residential mortgage loan originations and acquisitions totaled $1.66 billion compared to $1.19 billion for the fiscal year ended September 30, 2025. Of total residential mortgage loans originated and acquired during the most recent period, 86% were purchase transactions. Commitments originated for home equity loans and lines of credit were $2.31 billion for the fiscal year ended September 30, 2026 compared to $2.52 billion for the fiscal year ended September 30, 2025. During the fiscal years ended September 30, 2026 and 2025, there were $255.9 million and $411.3 million of loans sold with net gains on the sale of loans totaling $5.5 million and $5.3 million, respectively.
FHLB stock increased $30.1 million, or 12.8%, to $265.5 million at September 30, 2026 from $235.4 million at September 30, 2025.
Deposits decreased $267.8 million, or 2.6%, to $10.18 billion at September 30, 2026 from $10.45 billion at September 30, 2025. The decrease was the result of decreases of $868.8 million in CDs, $33.9 million in money market deposit accounts, and $3.0 million in checking accounts, partially offset by an increase of $646.3 million in savings accounts. The decrease in total CDs included a $984.2 million decrease in retail CDs, the majority of which moved into savings accounts, offset by a $115.4 million increase in brokered CD accounts. There were $1.02 billion in brokered certificates of deposit at September 30, 2026 compared to $900.9 million at September 30, 2025.
Borrowed funds increased $867.0 million, or 17.8%, to $5.74 billion at September 30, 2026 from $4.87 billion at September 30, 2025. The balance of borrowed funds at September 30, 2026 included $1.33 billion of overnight advances, $1.33 billion of term advances with a weighted average maturity of approximately 1.3 years and $3.03 billion of term advances, aligned with interest rate swap contracts, with a remaining weighted average effective maturity of approximately 2.4 years, all from the FHLB of Cincinnati, and federal funds purchased of $190.0 million.
Total shareholders' equity increased $112.4 million, or 5.9%, to $2.01 billion at September 30, 2026 from $1.89 billion at September 30, 2025. Activity reflects $100.7 million of net income, dividends paid of $62.3 million, $5.5 million in repurchases of the Company's common stock, a $68.3 million net increase in accumulated other comprehensive income and net positive adjustments of $11.2 million related to our stock compensation and employee stock ownership plans. The change in accumulated other comprehensive income was primarily due to a net increase in unrealized gains on swap contracts.
During the fiscal year ended September 30, 2026, a total of 384,241 shares of the Company's common stock were repurchased at an average cost of $14.31 per share. The Company's eighth stock repurchase program, authorized by the Board of Directors in October 2016, allows for a total of 10,000,000 shares to be repurchased, with 4,559,845 remaining shares authorized for repurchase at September 30, 2026.
The Company declared and paid a quarterly dividend of $0.3175 per share during the fourth fiscal quarter of 2026 and $0.2825 per share during each of the first three fiscal quarters. As a result of a mutual member vote, Third Federal Savings and Loan Association of Cleveland, MHC (the "MHC"), the mutual holding company that owns approximately 81% of the outstanding stock of the Company, was able to waive its receipt of its share of the dividends paid. Under Federal Reserve regulations, the MHC is required to obtain the approval of its members every 12 months for the MHC to waive its right to receive dividends. As a result of a July 7, 2026 member vote and the subsequent non-objection of the Federal Reserve, the MHC has the approval to waive receipt of up to $1.27 per share of possible dividends to be declared on the Company’s common stock during the twelve months subsequent to the members’ approval (i.e., through July 7, 2027). The MHC has conducted the member vote to approve the dividend waiver each of the past 13 years under Federal Reserve regulations and for each of those 13 years, approximately 97% of the votes cast were in favor of the waiver.
The Company operates under the capital requirements for the standardized approach of the Basel III capital framework for U.S. banking organizations (“Basel III Rules”). At September 30, 2026 all of the Company's capital ratios exceed the amounts required for the Company to be considered "well capitalized" for regulatory capital purposes. The Company's Tier 1 leverage ratio was 10.53%, its Common Equity Tier 1 and Tier 1 ratios were each 16.64% and its total capital ratio was 17.55%.
Fourth-Quarter Results Compared with the Prior Quarter
Net income decreased $5.8 million, or 19.0%, to $24.7 million for the quarter ended September 30, 2026 compared to $30.5 million for the quarter ended June 30, 2026, The change reflected higher net interest income offset by an unfavorable change in the provision for credit losses, a decrease in non-interest income and an increase in non-interest expense.
Net interest income increased $5.5 million, or 6.8%, to $86.9 million for the quarter ended September 30, 2026 from $81.4 million for the quarter ended June 30, 2026. This increase was primarily attributable to a 17 basis point increase in the yield on interest-earning assets, primarily loans, partially offset by a nine basis point increase in the cost of interest-bearing liabilities. The interest rate spread for the quarter improved by eight basis points over the prior quarter to 1.66%, while the net interest margin increased nine basis points to 1.99%.
For the quarter ended September 30, 2026, the Company recorded a provision for credit losses of $2.0 million compared to a $3.5 million release of provision for the prior quarter. The provision was driven by an increase in reserve requirements related to growth in the residential mortgage and home equity loan portfolios. The total allowance for credit losses increased $1.9 million during the quarter to $103.9 million, or 0.63% of total loans receivable, from $102.0 million, or 0.63% of total loans receivable, at June 30, 2026. The total allowance for credit losses included a $28.5 million liability for unfunded commitments, included in other liabilities, at both September 30, 2026 and June 30, 2026. Net charge-offs were $0.1 million for the quarter ended September 30, 2026 compared to net recoveries of $0.7 million for the previous quarter.
Total loan delinquencies increased $17.2 million to $60.7 million, or 0.37% of total loans receivable, at September 30, 2026 from $43.5 million, or 0.27% of total loans receivable, at June 30, 2026.
Total non-interest income decreased $1.3 million, or 16.5%, to $6.6 million for the quarter ended September 30, 2026 from $7.9 million for the quarter ended June 30, 2026. Changes included an increase of $0.2 million in loan fees and service charges, offset by decreases of $0.8 million from bank owned life insurance contracts, $0.5 million in other non-interest income, primarily related to unrealized losses on interest rate lock commitments treated as derivatives, and a $0.2 million decrease in net gain on the sale of loans.
Total non-interest expense increased $5.6 million, or 10.4%, to $59.7 million for the quarter ended September 30, 2026 from $54.1 million for the quarter ended June 30, 2026. Salaries and employee benefits increased $3.2 million primarily because payroll costs for the implementation of the new core banking system were no longer capitalized once the system began operating in July 2026. Other factors included increased federal payroll taxes, retirement plan expense and group health insurance costs. Other operating expenses increased $2.4 million primarily related to pension termination expense, partially offset by decreases in expenses related to down payment assistance.
Financial Condition at September 30, 2026 vs. June 30, 2026
Total assets increased $116.4 million to $18.19 billion at September 30, 2026 from $18.08 billion at June 30, 2026, mainly due to increases in loans held for investment partially offset by a decrease in cash and cash equivalents.
Cash and cash equivalents decreased $115.8 million, or 20.4%, to $453.1 million at September 30, 2026 from $568.9 million at June 30, 2026, due to normal fluctuations and liquidity management.
Loans held for investment, net of allowance and deferred loan expenses, increased $236.3 million, or 1.5%, to $16.42 billion at September 30, 2026. During the quarter ended September 30, 2026, the combined balances of home equity loans and lines of credit increased $210.5 million to $5.68 billion and residential mortgage loans increased $6.5 million to $10.70 billion. Residential mortgage loan originations and acquisitions were $479.3 million for the quarter ended September 30, 2026 compared to $616.4 million for the quarter ended June 30, 2026 and $427.9 million for the quarter ended September 30, 2025. Loans held for sale decreased $13.4 million to $1.1 million at September 30, 2026, from $14.5 million at June 30, 2026.
Deposits increased $186.8 million, or 1.9%, to $10.18 billion at September 30, 2026, compared to $9.99 billion at June 30, 2026. Certificates of deposit increased $317.3 million primarily reflecting the Company's offering of competitive deposit rates. Other changes included a $4.1 million decrease in money market deposit accounts, a $7.7 million decrease in checking accounts and a $105.7 million decrease in savings accounts.
Borrowed funds decreased $73.7 million, or 1.3%, to $5.74 billion at September 30, 2026, compared to $5.81 billion at June 30, 2026. The decrease reflected a decrease in advances from the FHLB of Cincinnati, partially offset by increases in federal funds purchased to maintain daily liquidity.
About TFS Financial Corporation
TFS Financial Corporation is the holding company for Third Federal Savings and Loan Association, a leading provider of savings and mortgage products that operates under the values of love, trust, respect, a commitment to excellence and fun. Founded in Cleveland in 1938 as a mutual association by Ben and Gerome Stefanski, Third Federal’s mission is to help people achieve the dream of home ownership and financial security while creating value for our customers, communities, associates and shareholders. It became part of a public company in 2007 and will celebrate its 90th anniversary in 2028. Third Federal, which lends in 28 states and the District of Columbia, is dedicated to serving consumers with competitive rates and outstanding service. Third Federal, an equal housing lender, has 21 full service branches in Northeast Ohio, two lending offices in Central and Southern Ohio, and 14 full service branches throughout Florida. As of September 30, 2026, the Company’s assets totaled $18.19 billion.
Presentation slides as of September 30, 2026 will be available on the Company's website, thirdfederal.com, under the Investor Relations link within the "Presentations" menu, beginning October 30, 2026. The Company will not be hosting a conference call to discuss its operating results.
Forward Looking Statements |
|
This report contains forward-looking statements, which can be identified by the use of such words as estimate, project, believe, intend, anticipate, plan, seek, expect and similar expressions. These forward-looking statements include, among other things: |
|
● |
statements of our goals, intentions and expectations; |
● |
statements regarding our business plans, prospects, growth and operating strategies; |
● |
statements concerning trends in our provision for credit losses and charge-offs on loans and off-balance sheet exposures; |
● |
statements regarding the trends in factors affecting our financial condition and results of operations, including credit quality of our loan and investment portfolios; and |
● |
estimates of our risks and future costs and benefits. |
|
|
These forward-looking statements are subject to significant risks, assumptions and uncertainties, including, among other things, the following important factors that could affect the actual outcome of future events: |
|
● |
significantly increased competition among depository and other financial institutions, including with respect to our ability to charge overdraft fees; |
● |
inflation and changes in the interest rate environment that reduce our interest margins or reduce the fair value of financial instruments, or our ability to originate loans; |
● |
general economic conditions, either globally, nationally or in our market areas, including employment prospects, real estate values and conditions that are worse than expected; |
● |
the strength or weakness of the real estate markets and of the consumer and commercial credit sectors and its impact on the credit quality of our loans and other assets, and changes in estimates of the allowance for credit losses; |
● |
decreased demand for our products and services and lower revenue and earnings because of a recession or other events; |
● |
changes in consumer spending, borrowing and savings habits, including repayment speeds on loans; |
● |
adverse changes and volatility in the securities markets, credit markets or real estate markets; |
● |
our ability to manage market risk, credit risk, liquidity risk, reputational risk, regulatory risk and compliance risk; |
● |
our ability to manage operational risk, including cybersecurity risk and artificial intelligence risk; |
● |
our ability to access cost-effective funding; |
● |
legislative or regulatory changes that adversely affect our business, including changes in regulatory costs and capital requirements and changes related to our ability to pay dividends and the ability of Third Federal Savings, MHC to waive dividends; |
● |
changes in accounting policies and practices, as may be adopted by the bank regulatory agencies, the FASB or the PCAOB; |
● |
the adoption of implementing regulations by a number of different regulatory bodies, and uncertainty in the exact nature, extent and timing of such regulations and the impact they will have on us; |
● |
our ability to enter new markets successfully and take advantage of growth opportunities; |
● |
future adverse developments concerning Fannie Mae or Freddie Mac; |
● |
changes in monetary and fiscal policy of the U.S. Government, including policies of the U.S. Treasury, the Federal Reserve System, Federal Housing Finance Agency, the OCC, FDIC, and others, and the effects of tariffs and retaliatory actions; |
● |
the ability of the U.S. Government to remain open, function properly and manage federal debt limits; |
● |
the continuing governmental efforts to restructure the U.S. financial and regulatory system; |
● |
changes in policy and/or assessment rates of taxing authorities that adversely affect us or our customers; |
● |
changes in accounting and tax estimates; |
● |
changes in our organization and changes in expense trends, including but not limited to trends affecting non-performing assets, charge-offs and provisions for credit losses; |
● |
the inability of third-party providers to perform their obligations to us; |
● |
changes in liquidity, including the size and composition of our deposit portfolio, and the percentage of uninsured deposits in the portfolio; |
● |
the effects of global or national war, conflict or acts of terrorism; |
● |
our ability to retain key associates; |
● |
cyber-attacks, computer viruses and other technological risks that may breach the security of our websites or other systems to obtain unauthorized access to confidential information, destroy data or disable our systems; and |
● |
the impact of a wide-spread pandemic, and related government action, on our business and the economy. |
Because of these and other uncertainties, our actual future results may be materially different from the results indicated by any forward-looking statements. Any forward-looking statement made by us in this report speaks only as of the date on which it is made. We undertake no obligation to publicly update any forward-looking statements, whether as a result of new information, future developments or otherwise, except as may be required by law. |
|
TFS FINANCIAL CORPORATION AND SUBSIDIARIES CONSOLIDATED STATEMENTS OF CONDITION (unaudited) (In thousands, except share data) |
|||||||||
|
September 30,
|
June 30,
|
September 30,
|
||||||
ASSETS |
|
|
|
||||||
Cash and due from banks |
$ |
31,859 |
|
$ |
28,623 |
|
$ |
24,176 |
|
Other interest-earning cash equivalents |
|
421,247 |
|
|
540,311 |
|
|
405,263 |
|
Cash and cash equivalents |
|
453,106 |
|
|
568,934 |
|
|
429,439 |
|
Investment securities available for sale |
|
494,637 |
|
|
482,431 |
|
|
520,659 |
|
Mortgage loans held for sale |
|
1,063 |
|
|
14,478 |
|
|
57,662 |
|
Loans held for investment, net: |
|
|
|
||||||
Mortgage loans |
|
16,411,444 |
|
|
16,175,429 |
|
|
15,659,460 |
|
Other loans |
|
7,374 |
|
|
7,423 |
|
|
8,153 |
|
Deferred loan expenses, net |
|
74,536 |
|
|
72,241 |
|
|
69,943 |
|
Allowance for credit losses on loans |
|
(75,485 |
) |
|
(73,516 |
) |
|
(74,244 |
) |
Loans, net |
|
16,417,869 |
|
|
16,181,577 |
|
|
15,663,312 |
|
Mortgage loan servicing rights, net |
|
8,771 |
|
|
8,861 |
|
|
8,549 |
|
Federal Home Loan Bank stock, at cost |
|
265,476 |
|
|
268,101 |
|
|
235,363 |
|
Real estate owned, net |
|
1,300 |
|
|
1,339 |
|
|
1,921 |
|
Premises, equipment, and software, net |
|
46,705 |
|
|
45,646 |
|
|
40,022 |
|
Accrued interest receivable |
|
66,962 |
|
|
63,689 |
|
|
62,553 |
|
Bank owned life insurance contracts |
|
330,729 |
|
|
329,784 |
|
|
325,149 |
|
Other assets |
|
104,767 |
|
|
110,168 |
|
|
111,687 |
|
TOTAL ASSETS |
$ |
18,191,385 |
|
$ |
18,075,008 |
|
$ |
17,456,316 |
|
LIABILITIES AND SHAREHOLDERS’ EQUITY |
|
|
|
||||||
Deposits |
$ |
10,179,201 |
|
$ |
9,992,423 |
|
$ |
10,446,968 |
|
Borrowed funds |
|
5,737,247 |
|
|
5,810,914 |
|
|
4,870,219 |
|
Borrowers’ advances for insurance and taxes |
|
120,038 |
|
|
159,734 |
|
|
113,168 |
|
Principal, interest, and related escrow owed on loans serviced |
|
31,181 |
|
|
44,683 |
|
|
30,328 |
|
Accrued expenses and other liabilities |
|
117,359 |
|
|
109,843 |
|
|
101,709 |
|
Total liabilities |
|
16,185,026 |
|
|
16,117,597 |
|
|
15,562,392 |
|
Commitments and contingent liabilities |
|
|
|
||||||
Preferred stock, $0.01 par value, 100,000,000 shares authorized, none issued and outstanding |
|
— |
|
|
— |
|
|
— |
|
Common stock, $0.01 par value, 700,000,000 shares authorized; 332,318,750 shares issued |
|
3,323 |
|
|
3,323 |
|
|
3,323 |
|
Paid-in capital |
|
1,764,213 |
|
|
1,761,637 |
|
|
1,757,813 |
|
Treasury stock, at cost |
|
(779,328 |
) |
|
(778,588 |
) |
|
(774,340 |
) |
Unallocated ESOP shares |
|
(14,084 |
) |
|
(15,167 |
) |
|
(18,417 |
) |
Retained earnings—substantially restricted |
|
985,190 |
|
|
977,589 |
|
|
946,776 |
|
Accumulated other comprehensive income (loss) |
|
47,045 |
|
|
8,617 |
|
|
(21,231 |
) |
Total shareholders’ equity |
|
2,006,359 |
|
|
1,957,411 |
|
|
1,893,924 |
|
TOTAL LIABILITIES AND SHAREHOLDERS’ EQUITY |
$ |
18,191,385 |
|
$ |
18,075,008 |
|
$ |
17,456,316 |
|
TFS FINANCIAL CORPORATION AND SUBSIDIARIES CONSOLIDATED STATEMENTS OF INCOME (unaudited) (In thousands, except share and per share data) |
||||||||||||||||
|
For the Three Months Ended |
|||||||||||||||
|
September 30,
|
|
June 30,
|
|
March 31,
|
|
December 31,
|
|
September 30,
|
|||||||
INTEREST AND DIVIDEND INCOME: |
|
|
|
|
|
|
|
|
|
|||||||
Loans, including fees |
$ |
201,094 |
|
$ |
190,048 |
|
|
$ |
183,515 |
|
$ |
184,946 |
|
|
$ |
185,332 |
Investment securities available for sale |
|
4,472 |
|
|
4,184 |
|
|
|
3,985 |
|
|
4,241 |
|
|
|
4,708 |
Other interest and dividend earning assets |
|
8,319 |
|
|
7,880 |
|
|
|
7,969 |
|
|
8,585 |
|
|
|
9,013 |
Total interest and dividend income |
|
213,885 |
|
|
202,112 |
|
|
|
195,469 |
|
|
197,772 |
|
|
|
199,053 |
INTEREST EXPENSE: |
|
|
|
|
|
|
|
|
|
|||||||
Deposits |
|
73,690 |
|
|
72,552 |
|
|
|
73,792 |
|
|
79,203 |
|
|
|
78,636 |
Borrowed funds |
|
53,281 |
|
|
48,182 |
|
|
|
43,871 |
|
|
42,889 |
|
|
|
43,094 |
Total interest expense |
|
126,971 |
|
|
120,734 |
|
|
|
117,663 |
|
|
122,092 |
|
|
|
121,730 |
NET INTEREST INCOME |
|
86,914 |
|
|
81,378 |
|
|
|
77,806 |
|
|
75,680 |
|
|
|
77,323 |
PROVISION (RELEASE) FOR CREDIT LOSSES |
|
2,000 |
|
|
(3,500 |
) |
|
|
— |
|
|
(1,000 |
) |
|
|
1,000 |
NET INTEREST INCOME AFTER PROVISION (RELEASE) FOR CREDIT LOSSES |
|
84,914 |
|
|
84,878 |
|
|
|
77,806 |
|
|
76,680 |
|
|
|
76,323 |
NON-INTEREST INCOME: |
|
|
|
|
|
|
|
|
|
|||||||
Fees and service charges, net of amortization |
|
2,987 |
|
|
2,753 |
|
|
|
2,498 |
|
|
2,512 |
|
|
|
2,617 |
Net gain on the sale of loans |
|
573 |
|
|
826 |
|
|
|
1,744 |
|
|
2,329 |
|
|
|
2,314 |
Increase in and death benefits from bank owned life insurance contracts |
|
2,588 |
|
|
3,394 |
|
|
|
2,718 |
|
|
2,764 |
|
|
|
2,650 |
Other |
|
473 |
|
|
923 |
|
|
|
477 |
|
|
443 |
|
|
|
580 |
Total non-interest income |
|
6,621 |
|
|
7,896 |
|
|
|
7,437 |
|
|
8,048 |
|
|
|
8,161 |
NON-INTEREST EXPENSE: |
|
|
|
|
|
|
|
|
|
|||||||
Salaries and employee benefits |
|
31,633 |
|
|
28,449 |
|
|
|
30,184 |
|
|
30,488 |
|
|
|
27,579 |
Marketing services |
|
3,761 |
|
|
4,060 |
|
|
|
4,026 |
|
|
6,239 |
|
|
|
4,537 |
Office property, equipment and software |
|
8,555 |
|
|
8,368 |
|
|
|
7,932 |
|
|
7,756 |
|
|
|
7,236 |
Federal insurance premium and assessments |
|
3,639 |
|
|
3,452 |
|
|
|
3,552 |
|
|
3,247 |
|
|
|
3,388 |
State franchise tax |
|
1,112 |
|
|
1,149 |
|
|
|
1,146 |
|
|
1,067 |
|
|
|
1,117 |
Other expenses |
|
11,001 |
|
|
8,618 |
|
|
|
8,559 |
|
|
7,433 |
|
|
|
8,188 |
Total non-interest expense |
|
59,701 |
|
|
54,096 |
|
|
|
55,399 |
|
|
56,230 |
|
|
|
52,045 |
INCOME BEFORE INCOME TAXES |
|
31,834 |
|
|
38,678 |
|
|
|
29,844 |
|
|
28,498 |
|
|
|
32,439 |
INCOME TAX EXPENSE |
|
7,179 |
|
|
8,138 |
|
|
|
6,597 |
|
|
6,224 |
|
|
|
6,440 |
NET INCOME |
$ |
24,655 |
|
$ |
30,540 |
|
|
$ |
23,247 |
|
$ |
22,274 |
|
|
$ |
25,999 |
Earnings per share - basic and diluted |
$ |
0.09 |
|
$ |
0.11 |
|
|
$ |
0.08 |
|
$ |
0.08 |
|
|
$ |
0.09 |
Weighted average shares outstanding |
|
|
|
|
|
|
|
|
|
|||||||
Basic |
|
278,954,026 |
|
|
278,850,699 |
|
|
|
278,858,428 |
|
|
278,754,792 |
|
|
|
278,764,271 |
Diluted |
|
280,475,264 |
|
|
280,176,516 |
|
|
|
279,934,262 |
|
|
279,908,875 |
|
|
|
279,887,491 |
TFS FINANCIAL CORPORATION AND SUBSIDIARIES CONSOLIDATED STATEMENTS OF INCOME (unaudited) (In thousands, except share and per share data) |
||||||
|
For the Year Ended |
|||||
|
September 30, |
|||||
|
|
2026 |
|
|
|
2025 |
INTEREST AND DIVIDEND INCOME: |
|
|
|
|||
Loans, including fees |
$ |
759,603 |
|
|
$ |
706,483 |
Investment securities available for sale |
|
16,882 |
|
|
|
18,734 |
Other interest and dividend earning assets |
|
32,753 |
|
|
|
37,963 |
Total interest and dividend income |
|
809,238 |
|
|
|
763,180 |
INTEREST EXPENSE: |
|
|
|
|||
Deposits |
|
299,237 |
|
|
|
308,760 |
Borrowed funds |
|
188,223 |
|
|
|
161,726 |
Total interest expense |
|
487,460 |
|
|
|
470,486 |
NET INTEREST INCOME |
|
321,778 |
|
|
|
292,694 |
PROVISION (RELEASE) FOR CREDIT LOSSES |
|
(2,500 |
) |
|
|
2,500 |
NET INTEREST INCOME AFTER PROVISION FOR CREDIT LOSSES |
|
324,278 |
|
|
|
290,194 |
NON-INTEREST INCOME: |
|
|
|
|||
Fees and service charges, net of amortization |
|
10,750 |
|
|
|
9,529 |
Net gain on the sale of loans |
|
5,472 |
|
|
|
5,342 |
Increase in and death benefits from bank owned life insurance contracts |
|
11,464 |
|
|
|
10,745 |
Other |
|
2,316 |
|
|
|
3,164 |
Total non-interest income |
|
30,002 |
|
|
|
28,780 |
NON-INTEREST EXPENSE: |
|
|
|
|||
Salaries and employee benefits |
|
120,754 |
|
|
|
109,502 |
Marketing services |
|
18,086 |
|
|
|
18,633 |
Office property, equipment and software |
|
32,611 |
|
|
|
29,350 |
Federal insurance premium and assessments |
|
13,890 |
|
|
|
14,165 |
State franchise tax |
|
4,474 |
|
|
|
4,567 |
Other expenses |
|
35,611 |
|
|
|
28,042 |
Total non-interest expense |
|
225,426 |
|
|
|
204,259 |
INCOME BEFORE INCOME TAXES |
|
128,854 |
|
|
|
114,715 |
INCOME TAX EXPENSE |
|
28,138 |
|
|
|
23,756 |
NET INCOME |
$ |
100,716 |
|
|
$ |
90,959 |
Earnings per share |
|
|
|
|||
Basic |
$ |
0.36 |
|
|
$ |
0.32 |
Diluted |
$ |
0.35 |
|
|
$ |
0.32 |
Weighted average shares outstanding |
|
|
|
|||
Basic |
|
278,854,475 |
|
|
|
278,715,769 |
Diluted |
|
280,119,148 |
|
|
|
279,758,525 |
TFS FINANCIAL CORPORATION AND SUBSIDIARIES AVERAGE BALANCES AND YIELDS (unaudited) |
|||||||||||||||||||||||||||||||||
|
|
Three Months Ended |
|
Three Months Ended |
|
Three Months Ended |
|||||||||||||||||||||||||||
|
|
September 30, 2026 |
|
June 30, 2026 |
|
September 30, 2025 |
|||||||||||||||||||||||||||
|
|
Average
|
|
Interest
|
|
Yield/
|
|
Average
|
|
Interest
|
|
Yield/
|
|
Average
|
|
Interest
|
|
Yield/
|
|||||||||||||||
|
|
(Dollars in thousands) |
|||||||||||||||||||||||||||||||
Interest-earning assets: |
|
|
|
|
|
|
|
|
|
|
|
|
|
|
|
|
|
|
|||||||||||||||
Interest-earning cash equivalents |
|
$ |
385,433 |
|
|
$ |
3,628 |
|
|
3.77 |
% |
|
$ |
381,320 |
|
|
$ |
3,459 |
|
|
3.63 |
% |
|
$ |
385,290 |
|
|
$ |
4,180 |
|
|
4.34 |
% |
Investment securities |
|
|
48,403 |
|
|
|
480 |
|
|
3.97 |
% |
|
|
26,013 |
|
|
|
298 |
|
|
4.58 |
% |
|
|
53,974 |
|
|
|
552 |
|
|
4.09 |
% |
Mortgage-backed securities |
|
|
434,502 |
|
|
|
3,992 |
|
|
3.68 |
% |
|
|
443,351 |
|
|
|
3,886 |
|
|
3.51 |
% |
|
|
463,128 |
|
|
|
4,156 |
|
|
3.59 |
% |
Loans (2) |
|
|
16,364,949 |
|
|
|
201,094 |
|
|
4.92 |
% |
|
|
16,018,277 |
|
|
|
190,048 |
|
|
4.75 |
% |
|
|
15,705,190 |
|
|
|
185,332 |
|
|
4.72 |
% |
Federal Home Loan Bank stock |
|
|
264,042 |
|
|
|
4,691 |
|
|
7.11 |
% |
|
|
252,243 |
|
|
|
4,421 |
|
|
7.01 |
% |
|
|
235,975 |
|
|
|
4,833 |
|
|
8.19 |
% |
Total interest-earning assets |
|
|
17,497,329 |
|
|
|
213,885 |
|
|
4.89 |
% |
|
|
17,121,204 |
|
|
|
202,112 |
|
|
4.72 |
% |
|
|
16,843,557 |
|
|
|
199,053 |
|
|
4.73 |
% |
Noninterest-earning assets |
|
|
502,763 |
|
|
|
|
|
|
|
518,146 |
|
|
|
|
|
|
|
570,470 |
|
|
|
|
|
|||||||||
Total assets |
|
$ |
18,000,092 |
|
|
|
|
|
|
$ |
17,639,350 |
|
|
|
|
|
|
$ |
17,414,027 |
|
|
|
|
|
|||||||||
Interest-bearing liabilities: |
|
|
|
|
|
|
|
|
|
|
|
|
|
|
|
|
|
|
|||||||||||||||
Checking accounts |
|
$ |
772,909 |
|
|
|
20 |
|
|
0.01 |
% |
|
$ |
787,158 |
|
|
|
19 |
|
|
0.01 |
% |
|
$ |
797,552 |
|
|
|
172 |
|
|
0.09 |
% |
Savings accounts |
|
|
1,814,879 |
|
|
|
8,456 |
|
|
1.86 |
% |
|
|
1,871,979 |
|
|
|
8,745 |
|
|
1.87 |
% |
|
|
1,104,938 |
|
|
|
3,192 |
|
|
1.16 |
% |
Certificates of deposit |
|
|
7,466,391 |
|
|
|
65,214 |
|
|
3.49 |
% |
|
|
7,421,813 |
|
|
|
63,788 |
|
|
3.44 |
% |
|
|
8,451,255 |
|
|
|
75,272 |
|
|
3.56 |
% |
Borrowed funds |
|
|
5,692,336 |
|
|
|
53,281 |
|
|
3.74 |
% |
|
|
5,320,453 |
|
|
|
48,182 |
|
|
3.62 |
% |
|
|
4,911,194 |
|
|
|
43,094 |
|
|
3.51 |
% |
Total interest-bearing liabilities |
|
|
15,746,515 |
|
|
|
126,971 |
|
|
3.23 |
% |
|
|
15,401,403 |
|
|
|
120,734 |
|
|
3.14 |
% |
|
|
15,264,939 |
|
|
|
121,730 |
|
|
3.19 |
% |
Noninterest-bearing liabilities |
|
|
259,083 |
|
|
|
|
|
|
|
279,674 |
|
|
|
|
|
|
|
229,685 |
|
|
|
|
|
|||||||||
Total liabilities |
|
|
16,005,598 |
|
|
|
|
|
|
|
15,681,077 |
|
|
|
|
|
|
|
15,494,624 |
|
|
|
|
|
|||||||||
Shareholders’ equity |
|
|
1,994,494 |
|
|
|
|
|
|
|
1,958,273 |
|
|
|
|
|
|
|
1,919,403 |
|
|
|
|
|
|||||||||
Total liabilities and shareholders’ equity |
|
$ |
18,000,092 |
|
|
|
|
|
|
$ |
17,639,350 |
|
|
|
|
|
|
$ |
17,414,027 |
|
|
|
|
|
|||||||||
Net interest income |
|
|
|
$ |
86,914 |
|
|
|
|
|
|
$ |
81,378 |
|
|
|
|
|
|
$ |
77,323 |
|
|
|
|||||||||
Interest rate spread (1)(3) |
|
|
|
|
|
1.66 |
% |
|
|
|
|
|
1.58 |
% |
|
|
|
|
|
1.54 |
% |
||||||||||||
Net interest-earning assets (4) |
|
$ |
1,750,814 |
|
|
|
|
|
|
$ |
1,719,801 |
|
|
|
|
|
|
$ |
1,578,618 |
|
|
|
|
|
|||||||||
Net interest margin (1)(5) |
|
|
|
|
1.99 |
% |
|
|
|
|
|
|
1.90 |
% |
|
|
|
|
|
|
1.84 |
% |
|
|
|||||||||
Average interest-earning assets to average interest-bearing liabilities |
|
|
111.12 |
% |
|
|
|
|
|
|
111.17 |
% |
|
|
|
|
|
|
110.34 |
% |
|
|
|
|
|||||||||
Selected performance ratios: |
|
|
|
|
|
|
|
|
|
|
|
|
|
|
|
|
|
|
|||||||||||||||
Return on average assets (1) |
|
|
|
|
0.55 |
% |
|
|
|
|
|
|
0.69 |
% |
|
|
|
|
|
|
0.60 |
% |
|
|
|||||||||
Return on average equity (1) |
|
|
|
|
4.94 |
% |
|
|
|
|
|
|
6.24 |
% |
|
|
|
|
|
|
5.42 |
% |
|
|
|||||||||
Average equity to average assets |
|
|
|
|
11.08 |
% |
|
|
|
|
|
|
11.10 |
% |
|
|
|
|
|
|
11.02 |
% |
|
|
|||||||||
(1) |
Annualized. |
(2) |
Loans include both mortgage loans held for sale and loans held for investment. |
(3) |
Interest rate spread represents the difference between the yield on average interest-earning assets and the cost of average interest-bearing liabilities. |
(4) |
Net interest-earning assets represent total interest-earning assets less total interest-bearing liabilities. |
(5) |
Net interest margin represents net interest income divided by total interest-earning assets. |
TFS FINANCIAL CORPORATION AND SUBSIDIARIES AVERAGE BALANCES AND YIELDS (unaudited) |
||||||||||||||||||||||
|
|
Year Ended |
|
Year Ended |
||||||||||||||||||
|
|
September 30, 2026 |
|
September 30, 2025 |
||||||||||||||||||
|
|
Average Balance |
|
Interest Income/ Expense |
|
Yield/ Cost (1) |
|
Average Balance |
|
Interest Income/ Expense |
|
Yield/ Cost (1) |
||||||||||
|
|
(Dollars in thousands) |
||||||||||||||||||||
Interest-earning assets: |
|
|
|
|
|
|
|
|
|
|
|
|
||||||||||
Interest-earning cash equivalents |
|
$ |
385,956 |
|
|
$ |
14,475 |
|
|
3.75 |
% |
|
$ |
403,751 |
|
|
$ |
18,061 |
|
|
4.47 |
% |
Investment securities |
|
|
24,607 |
|
|
|
983 |
|
|
3.99 |
% |
|
|
55,584 |
|
|
|
2,328 |
|
|
4.19 |
% |
Mortgage-backed securities |
|
|
448,031 |
|
|
|
15,899 |
|
|
3.55 |
% |
|
|
464,581 |
|
|
|
16,406 |
|
|
3.53 |
% |
Loans (1) |
|
|
15,994,200 |
|
|
|
759,603 |
|
|
4.75 |
% |
|
|
15,464,682 |
|
|
|
706,483 |
|
|
4.57 |
% |
Federal Home Loan Bank stock |
|
|
247,219 |
|
|
|
18,278 |
|
|
7.39 |
% |
|
|
225,865 |
|
|
|
19,902 |
|
|
8.81 |
% |
Total interest-earning assets |
|
|
17,100,013 |
|
|
|
809,238 |
|
|
4.73 |
% |
|
|
16,614,463 |
|
|
|
763,180 |
|
|
4.59 |
% |
Noninterest-earning assets |
|
|
523,009 |
|
|
|
|
|
|
|
544,412 |
|
|
|
|
|
||||||
Total assets |
|
$ |
17,623,022 |
|
|
|
|
|
|
$ |
17,158,875 |
|
|
|
|
|
||||||
Interest-bearing liabilities: |
|
|
|
|
|
|
|
|
|
|
|
|
||||||||||
Checking accounts |
|
$ |
785,721 |
|
|
|
148 |
|
|
0.02 |
% |
|
$ |
814,140 |
|
|
|
439 |
|
|
0.05 |
% |
Savings accounts |
|
|
1,660,944 |
|
|
|
28,009 |
|
|
1.69 |
% |
|
|
1,241,856 |
|
|
|
12,640 |
|
|
1.02 |
% |
Certificates of deposit |
|
|
7,749,607 |
|
|
|
271,080 |
|
|
3.50 |
% |
|
|
8,255,097 |
|
|
|
295,681 |
|
|
3.58 |
% |
Borrowed funds |
|
|
5,210,324 |
|
|
|
188,223 |
|
|
3.61 |
% |
|
|
4,675,665 |
|
|
|
161,726 |
|
|
3.46 |
% |
Total interest-bearing liabilities |
|
|
15,406,596 |
|
|
|
487,460 |
|
|
3.16 |
% |
|
|
14,986,758 |
|
|
|
470,486 |
|
|
3.14 |
% |
Noninterest-bearing liabilities |
|
|
265,869 |
|
|
|
|
|
|
|
251,778 |
|
|
|
|
|
||||||
Total liabilities |
|
|
15,672,465 |
|
|
|
|
|
|
|
15,238,536 |
|
|
|
|
|
||||||
Shareholders’ equity |
|
|
1,950,557 |
|
|
|
|
|
|
|
1,920,339 |
|
|
|
|
|
||||||
Total liabilities and shareholders’ equity |
|
$ |
17,623,022 |
|
|
|
|
|
|
$ |
17,158,875 |
|
|
|
|
|
||||||
Net interest income |
|
|
|
$ |
321,778 |
|
|
|
|
|
|
$ |
292,694 |
|
|
|
||||||
Interest rate spread (2) |
|
|
|
|
|
1.57 |
% |
|
|
|
|
|
1.45 |
% |
||||||||
Net interest-earning assets (3) |
|
$ |
1,693,417 |
|
|
|
|
|
|
$ |
1,627,705 |
|
|
|
|
|
||||||
Net interest margin (4) |
|
|
|
|
1.88 |
% |
|
|
|
|
|
|
1.76 |
% |
|
|
||||||
Average interest-earning assets to average interest-bearing liabilities |
|
|
110.99 |
% |
|
|
|
|
|
|
110.86 |
% |
|
|
|
|
||||||
Selected performance ratios: |
|
|
|
|
|
|
|
|
|
|
|
|
||||||||||
Return on average assets |
|
|
|
|
0.57 |
% |
|
|
|
|
|
|
0.53 |
% |
|
|
||||||
Return on average equity |
|
|
|
|
5.16 |
% |
|
|
|
|
|
|
4.74 |
% |
|
|
||||||
Average equity to average assets |
|
|
|
|
11.07 |
% |
|
|
|
|
|
|
11.19 |
% |
|
|
||||||
(1) |
Loans include both mortgage loans held for sale and loans held for investment. |
(2) |
Interest rate spread represents the difference between the yield on average interest-earning assets and the cost of average interest-bearing liabilities. |
(3) |
Net interest-earning assets represent total interest-earning assets less total interest-bearing liabilities. |
(4) |
Net interest margin represents net interest income divided by total interest-earning assets. |
Contacts
Jennifer Rosa
(216) 429-5037