Travel + Leisure Co. Reports Second Quarter 2026 Results
Travel + Leisure Co. Reports Second Quarter 2026 Results
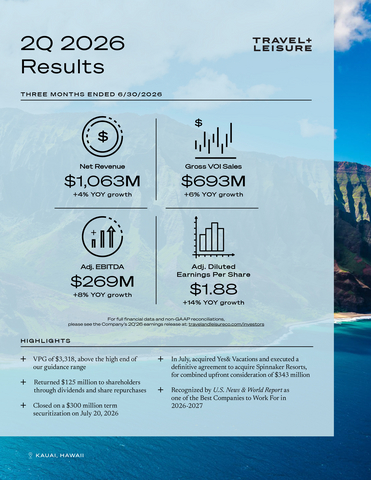
ORLANDO, Fla.--(BUSINESS WIRE)--Travel + Leisure Co. (NYSE:TNL), a leading leisure travel company, today reported second quarter 2026 financial results for the three months ended June 30, 2026. Highlights and outlook include:
- Net revenue of $1.06 billion. Gross VOI sales of $693 million, up 4% and 6% year-over-year, respectively(1)
- Net income of $109 million (diluted earnings per share of $1.72)
- Adjusted EBITDA of $269 million and Adjusted diluted earnings per share of $1.88, representing 8% and 14% year-over-year growth, respectively(1)
- Volume per guest (VPG) of $3,318, a 2% increase year-over-year
- Boosts full-year Adjusted EBITDA guidance range to $1,065 million to $1,085 million
- Returned $125 million to shareholders through $37 million of dividends and $88 million of share repurchases
"We delivered another strong quarter driven by a highly engaged owner base and exceptional execution across our Vacation Ownership business. We also announced two acquisitions that add more than 100,000 owners and expand our presence in some of the most attractive leisure markets in the country. Together, our operating performance and the addition of these businesses extend the growth opportunity in front of us and give us the confidence to raise our full year outlook," said Michael Brown, President & CEO of Travel + Leisure Co.
Erik Hoag, Chief Financial Officer said, "First half results reflect the strength of our model and capital allocation strategy. Revenue increased 4%, EBITDA increased 9% and adjusted earnings per share increased 21%. At the same time, we increased share repurchases by 25%, reduced leverage by approximately a quarter turn and announced two immediately-accretive acquisitions."
(1) This press release includes Adjusted EBITDA, Adjusted diluted EPS, Adjusted free cash flow, Gross VOI sales, Adjusted net income, and Adjusted EBITDA margin, which are measures that are not calculated in accordance with Generally Accepted Accounting Principles in the U.S. (“GAAP”). See "Presentation of Financial Information" and the tables for the definitions and reconciliations of these non-GAAP measures. Forward-looking non-GAAP measures are presented in this press release only on a non-GAAP basis because not all of the information necessary for a quantitative reconciliation is available without unreasonable effort. |
Business Segment Results
Vacation Ownership
$ in millions |
Q2 2026 |
Q2 2025 |
% change |
Revenue |
$907 |
$853 |
6 % |
Adjusted EBITDA |
$247 |
$218 |
13 % |
Vacation Ownership revenue increased 6% to $907 million in the second quarter of 2026 compared to the same period in the prior year. Net vacation ownership interest (VOI) sales increased 11% year over year. Gross VOI sales increased 6% driven by a 2% increase in VPG and a 1% increase in tours.
Second quarter Adjusted EBITDA was $247 million compared to $218 million in the prior year period driven by the revenue growth and expense savings from the resort optimization initiative.
Travel and Membership
$ in millions |
Q2 2026 |
Q2 2025 |
% change |
Revenue |
$157 |
$166 |
(5) % |
Adjusted EBITDA |
$49 |
$55 |
(11) % |
Travel and Membership revenue decreased 5% to $157 million in the second quarter of 2026 compared to the same period in the prior year. This was driven by an $8 million decrease in transaction revenue due to a 12% decrease in revenue per transaction, partially offset by a 6% increase in transaction volume.
Second quarter Adjusted EBITDA decreased 11% to $49 million compared to the prior year period. This decrease was driven by a decline in exchange transaction volume and a higher mix of travel club transactions that generate lower margins, partially offset by lower operating costs.
Balance Sheet and Liquidity
Net Debt — During the second quarter we issued $900 million of senior secured notes with an interest rate of 6.25%. The proceeds of this offering were used to redeem all of our $650 million 6.625% secured notes that were due July 2026, toward repayment of outstanding borrowings under the revolving credit facility, to pay the fees and expenses incurred in connection with the issuance, and for general corporate purposes. The Company had $3.7 billion of corporate debt outstanding as of June 30, 2026, which excluded $2.0 billion of non-recourse debt related to its securitized notes receivables portfolio. As of June 30, 2026, the Company's leverage ratio for covenant purposes was below 3.2x.
Timeshare Receivables Financing — Subsequent to the end of the quarter, the Company closed on a $300 million term securitization transaction with a weighted average coupon of 5.52% and a 98% advance rate.
Cash Flow — For the six months ended June 30, 2026, net cash provided by operating activities was $258 million compared to $353 million in the prior year period. Adjusted free cash flow was $95 million for the six months ended June 30, 2026 compared to $123 million in the same period of 2025.
Share Repurchases — During the second quarter of 2026, the Company repurchased 1.2 million shares of common stock for $88 million at a weighted average price of $69.50 per share. As of June 30, 2026, the Company had $745 million remaining in its share repurchase authorization.
Dividend — The Company paid $37 million ($0.60 per share) in cash dividends on June 30, 2026 to shareholders of record as of June 12, 2026. Management will recommend a third quarter dividend of $0.60 per share for approval by the Company’s Board of Directors in August 2026.
Resort Optimization Initiative — In order to promote the long-term strength of our vacation ownership resorts, we undertook a strategic review during 2025 with the intent of optimizing the overall quality of our resort portfolio, aligning with evolving owner preferences, preserving the affordability of maintenance fees, and mitigating the need for costly special assessments in the future. This review identified 17 resorts requiring significant owner reinvestment, or that are in markets that no longer align with owner demand. This initiative has generated, and is expected to generate further, meaningful savings attributable to developer obligations, which represent the maintenance fees the Company incurs on unsold VOIs. Such savings are partially offset by the loss of, or reduction in, VOI sales and property management fees earned at the impacted resorts, but are expected to result in a positive net impact to Adjusted EBITDA in 2026. In connection with these actions, the Company incurred $6 million and $25 million of inventory write-downs and impairments during the three and six months ended June 30, 2026.
Outlook
The Company is providing guidance for the third quarter 2026:
- Adjusted EBITDA of $275 million to $285 million
- Gross VOI sales of $700 million to $740 million
- VPG of $3,300 to $3,350
The Company is raising guidance for the 2026 full year:
- Adjusted EBITDA of $1,065 million to $1,085 million
- Gross VOI sales of $2.600 billion to $2.675 billion
- VPG of $3,325 to $3,375
This guidance is presented only on a non-GAAP basis because not all of the information necessary for a quantitative reconciliation of forward-looking non-GAAP financial measures to the most directly comparable GAAP financial measure is available without unreasonable effort, primarily due to uncertainties relating to the occurrence or amount of these adjustments that may arise in the future. Where one or more of the currently unavailable items is applicable, some items could be material, individually or in the aggregate, to GAAP reported results.
Conference Call Information
Travel + Leisure Co. will hold a conference call with investors to discuss the Company’s results and outlook today at 8:30 a.m. ET. Participants may listen to a simultaneous webcast of the conference call, which may be accessed through the Company's website at travelandleisureco.com/investors, or by dialing 877-733-4794 ten minutes before the scheduled start time. For those unable to listen to the live broadcast, an archive of the webcast will be available on the Company's website for 90 days beginning at 12:00 p.m. ET today.
Presentation of Financial Information
Financial information discussed in this press release includes non-GAAP measures such as Adjusted EBITDA, Adjusted diluted EPS, Adjusted free cash flow, gross VOI sales, Adjusted net income, Adjusted pre-tax income and Adjusted EBITDA margin, which include or exclude certain items, as well as non-GAAP guidance. The Company utilizes non-GAAP measures, defined in Table 7, on a regular basis to assess performance of its reportable segments and allocate resources. These non-GAAP measures differ from reported GAAP results and are intended to illustrate what management believes are relevant period-over-period comparisons and are helpful to investors when considered with GAAP measures as an additional tool for further understanding and assessing the Company’s ongoing operating performance by adjusting for items which in our view do not necessarily reflect ongoing performance. Management also internally uses these measures to assess our operating performance, both absolutely and in comparison to other companies, and in evaluating or making selected compensation decisions. Exclusion of items in the Company’s non-GAAP presentation should not be considered an inference that these items are unusual, infrequent or non-recurring. Full reconciliations of non-GAAP financial measures to the most directly comparable GAAP financial measures for the reported periods appear in the financial tables section of the press release.
The Company may use its website as a means of disclosing information concerning its operations, results and prospects, including information which may constitute material nonpublic information, and for complying with its disclosure obligations under SEC Regulation FD. Disclosure of such information will be included on the Company’s website in the Investor Relations section at travelandleisureco.com/investors. Accordingly, investors should monitor that Investor Relations section of the Company website, in addition to accessing its press releases, its submissions and filings with the SEC, and its publicly noticed conference calls and webcasts.
About Travel + Leisure Co.
Travel + Leisure Co. (NYSE: TNL) is a leading leisure travel company, providing more than six million vacations to travelers around the world every year. The Company operates a diverse portfolio of vacation ownership, travel club, and lifestyle travel brands designed to meet the needs of the modern leisure traveler, whether they’re traversing the globe or enjoying destinations closer to home. This includes experiential brands such as Sports Illustrated Resorts, Eddie Bauer Adventure Club, Margaritaville Vacation Club, and Accor Vacation Club, as well as cornerstone brands Club Wyndham, WorldMark, and RCI. With hospitality and responsible tourism at its heart, the Company’s more than 19,000 dedicated associates worldwide help fulfill its mission to put the world on vacation. Learn more at travelandleisureco.com.
Forward-Looking Statements
This press release includes “forward-looking statements” as that term is defined by the Securities and Exchange Commission (“SEC”). Forward-looking statements are any statements other than statements of historical fact, including statements regarding our expectations, beliefs, hopes, intentions or strategies regarding the future. In some cases, forward-looking statements can be identified by the use of words such as “may,” “will,” “expects,” “should,” “believes,” “plans,” “anticipates,” "intends," “estimates,” “predicts,” “potential,” "projects," “continue,” “future,” "outlook," "guidance," "commitments," or other words of similar meaning. Forward-looking statements are subject to risks and uncertainties that could cause actual results of Travel + Leisure Co. and its subsidiaries (“Travel + Leisure Co.” or “we”) to differ materially from those discussed in, or implied by, the forward-looking statements. Factors that might cause such a difference include, but are not limited to, risks associated with: the acquisition of the Travel + Leisure brand and the future prospects and plans for Travel + Leisure Co., including our ability to execute our strategies to grow our cornerstone timeshare and exchange businesses and expand into the broader leisure travel industry; our ability to compete in the highly competitive timeshare and leisure travel industries; uncertainties related to acquisitions, dispositions and other strategic transactions; the health of the travel industry and declines or disruptions caused by adverse economic conditions (including inflation, recent tariff and other trade restrictions, higher interest rates, and recessionary pressures, travel restrictions, terrorism or acts of violence, political strife, war (including hostilities in Ukraine and the Middle East), pandemics, and severe weather events and other natural disasters; adverse changes in consumer travel and vacation patterns, consumer preferences and demand for our products; increased or unanticipated operating costs and other inherent business risks; our ability to comply with financial and restrictive covenants under our indebtedness; our ability to access capital and insurance markets on reasonable terms, at a reasonable cost or at all; maintaining the integrity of internal or customer data and protecting our systems from cyber-attacks; the timing and amount of future dividends and share repurchases, if any; and those other factors disclosed as risks under “Risk Factors” in documents we have filed with the SEC, including in Part I, Item 1A of our Annual Report on Form 10-K for the fiscal year ended December 31, 2025, filed with the SEC on February 18, 2026. We caution readers that any such statements are based on currently available operational, financial and competitive information, and they should not place undue reliance on these forward-looking statements, which reflect management’s opinion only as of the date on which they were made. Except as required by law, we undertake no obligation to review or update these forward-looking statements to reflect events or circumstances as they occur.
Table 1 |
|||||||||||||||
Travel + Leisure Co. Condensed Consolidated Statements of Income (Unaudited) (in millions, except per share amounts) |
|||||||||||||||
|
Three Months Ended |
|
Six Months Ended |
||||||||||||
|
June 30, |
|
June 30, |
||||||||||||
|
|
2026 |
|
|
|
2025 |
|
|
|
2026 |
|
|
|
2025 |
|
Net Revenues |
|
|
|
|
|
|
|
||||||||
Net VOI sales |
$ |
524 |
|
|
$ |
474 |
|
|
$ |
951 |
|
|
$ |
858 |
|
Service and membership fees |
|
396 |
|
|
|
407 |
|
|
|
792 |
|
|
|
823 |
|
Consumer financing |
|
113 |
|
|
|
112 |
|
|
|
226 |
|
|
|
224 |
|
Other |
|
30 |
|
|
|
25 |
|
|
|
55 |
|
|
|
46 |
|
Net revenues |
|
1,063 |
|
|
|
1,018 |
|
|
|
2,024 |
|
|
|
1,951 |
|
|
|
|
|
|
|
|
|
||||||||
Expenses |
|
|
|
|
|
|
|
||||||||
Operating |
|
457 |
|
|
|
457 |
|
|
|
898 |
|
|
|
902 |
|
Marketing |
|
172 |
|
|
|
152 |
|
|
|
314 |
|
|
|
276 |
|
General and administrative |
|
130 |
|
|
|
116 |
|
|
|
253 |
|
|
|
236 |
|
Consumer financing interest |
|
33 |
|
|
|
34 |
|
|
|
65 |
|
|
|
68 |
|
Depreciation and amortization |
|
32 |
|
|
|
31 |
|
|
|
64 |
|
|
|
61 |
|
Cost of vacation ownership interests |
|
29 |
|
|
|
21 |
|
|
|
63 |
|
|
|
45 |
|
Asset impairments, net |
|
— |
|
|
|
1 |
|
|
|
— |
|
|
|
1 |
|
Restructuring |
|
— |
|
|
|
— |
|
|
|
(2 |
) |
|
|
— |
|
Total expenses |
|
853 |
|
|
|
812 |
|
|
|
1,655 |
|
|
|
1,589 |
|
Operating income |
|
210 |
|
|
|
206 |
|
|
|
369 |
|
|
|
362 |
|
Interest expense |
|
59 |
|
|
|
57 |
|
|
|
115 |
|
|
|
115 |
|
Other (income), net |
|
(2 |
) |
|
|
(1 |
) |
|
|
(4 |
) |
|
|
(2 |
) |
Interest (income) |
|
(2 |
) |
|
|
(2 |
) |
|
|
(5 |
) |
|
|
(4 |
) |
Income before income taxes |
|
155 |
|
|
|
152 |
|
|
|
263 |
|
|
|
253 |
|
Provision for income taxes |
|
46 |
|
|
|
44 |
|
|
|
75 |
|
|
|
72 |
|
Net income attributable to Travel + Leisure Co. shareholders |
$ |
109 |
|
|
$ |
108 |
|
|
$ |
188 |
|
|
$ |
181 |
|
|
|
|
|
|
|
|
|
||||||||
Earnings per share |
|
|
|
|
|
|
|
||||||||
Basic |
$ |
1.75 |
|
|
$ |
1.63 |
|
|
$ |
3.00 |
|
|
$ |
2.71 |
|
Diluted |
$ |
1.72 |
|
|
$ |
1.62 |
|
|
$ |
2.94 |
|
|
$ |
2.68 |
|
|
|
|
|
|
|
|
|
||||||||
Weighted average shares outstanding |
|
|
|
|
|
|
|
||||||||
Basic |
|
62.3 |
|
|
|
66.1 |
|
|
|
62.6 |
|
|
|
66.6 |
|
Diluted |
|
63.4 |
|
|
|
66.5 |
|
|
|
64.0 |
|
|
|
67.3 |
|
Table 2 |
|||||||
Travel + Leisure Co. Condensed Consolidated Balance Sheets (Unaudited) (in millions, except share data) |
|||||||
|
June 30,
|
|
December 31,
|
||||
Assets |
|
|
|
||||
Cash and cash equivalents |
$ |
282 |
|
|
$ |
253 |
|
Restricted cash |
|
189 |
|
|
|
173 |
|
Trade receivables, net |
|
152 |
|
|
|
165 |
|
Vacation ownership contract receivables, net |
|
2,589 |
|
|
|
2,638 |
|
Inventory |
|
1,179 |
|
|
|
1,128 |
|
Prepaid expenses |
|
264 |
|
|
|
214 |
|
Property and equipment, net |
|
524 |
|
|
|
531 |
|
Goodwill |
|
972 |
|
|
|
972 |
|
Other intangibles, net |
|
197 |
|
|
|
201 |
|
Other assets |
|
548 |
|
|
|
485 |
|
Total assets |
$ |
6,896 |
|
|
$ |
6,760 |
|
Liabilities and (deficit) |
|
|
|
||||
Accounts payable |
$ |
59 |
|
|
$ |
62 |
|
Accrued expenses and other liabilities |
|
957 |
|
|
|
910 |
|
Deferred income |
|
462 |
|
|
|
468 |
|
Non-recourse vacation ownership debt |
|
2,010 |
|
|
|
2,124 |
|
Debt |
|
3,700 |
|
|
|
3,474 |
|
Deferred income taxes |
|
728 |
|
|
|
704 |
|
Total liabilities |
|
7,916 |
|
|
|
7,742 |
|
Stockholders' (deficit): |
|
|
|
||||
Preferred stock, $0.01 par value, authorized 6,000,000 shares, none issued and outstanding |
|
— |
|
|
|
— |
|
Common stock, $0.01 par value, 600,000,000 shares authorized, 226,628,187 issued as of 2026 and 225,937,948 as of 2025 |
|
3 |
|
|
|
3 |
|
Treasury stock, at cost – 165,346,102 shares as of 2026 and 162,880,360 shares as of 2025 |
|
(7,912 |
) |
|
|
(7,735 |
) |
Additional paid-in capital |
|
4,430 |
|
|
|
4,405 |
|
Retained earnings |
|
2,524 |
|
|
|
2,412 |
|
Accumulated other comprehensive loss |
|
(64 |
) |
|
|
(66 |
) |
Total stockholders’ (deficit) |
|
(1,019 |
) |
|
|
(981 |
) |
Noncontrolling interest |
|
(1 |
) |
|
|
(1 |
) |
Total (deficit) |
|
(1,020 |
) |
|
|
(982 |
) |
Total liabilities and (deficit) |
$ |
6,896 |
|
|
$ |
6,760 |
|
Table 3 |
|||||||
Travel + Leisure Co. Condensed Consolidated Statements of Cash Flows (Unaudited) (in millions) |
|||||||
|
Six Months Ended |
||||||
|
June 30, |
||||||
|
|
2026 |
|
|
|
2025 |
|
Operating activities |
|
|
|
||||
Net income |
$ |
188 |
|
|
$ |
181 |
|
Adjustments to reconcile net income to net cash provided by operating activities: |
|
|
|
||||
Provision for loan losses |
|
241 |
|
|
|
219 |
|
Depreciation and amortization |
|
64 |
|
|
|
61 |
|
Stock-based compensation |
|
28 |
|
|
|
26 |
|
Inventory write-downs and impairments |
|
25 |
|
|
|
— |
|
Deferred income taxes |
|
24 |
|
|
|
23 |
|
Non-cash interest |
|
12 |
|
|
|
12 |
|
Non-cash lease expense |
|
6 |
|
|
|
7 |
|
Asset impairments, net |
|
— |
|
|
|
1 |
|
Other, net |
|
(5 |
) |
|
|
(2 |
) |
Net change in assets and liabilities, excluding the impact of acquisitions and dispositions: |
|
|
|
||||
Trade receivables |
|
17 |
|
|
|
(14 |
) |
Vacation ownership contract receivables |
|
(189 |
) |
|
|
(161 |
) |
Inventory |
|
(75 |
) |
|
|
(16 |
) |
Prepaid expenses |
|
(49 |
) |
|
|
(27 |
) |
Other assets |
|
(25 |
) |
|
|
18 |
|
Accounts payable, accrued expenses, and other liabilities |
|
3 |
|
|
|
5 |
|
Deferred income |
|
(7 |
) |
|
|
20 |
|
Net cash provided by operating activities |
|
258 |
|
|
|
353 |
|
|
|
|
|
||||
Investing activities |
|
|
|
||||
Property and equipment additions |
|
(44 |
) |
|
|
(58 |
) |
Purchase of investments |
|
(13 |
) |
|
|
(4 |
) |
Proceeds from the sale of investments |
|
13 |
|
|
|
15 |
|
Acquisitions, net of cash acquired |
|
— |
|
|
|
(1 |
) |
Net cash used in investing activities |
|
(44 |
) |
|
|
(48 |
) |
|
|
|
|
||||
Financing activities |
|
|
|
||||
Proceeds from non-recourse vacation ownership debt |
|
748 |
|
|
|
644 |
|
Principal payments on non-recourse vacation ownership debt |
|
(867 |
) |
|
|
(816 |
) |
Proceeds from debt, notes issued, and term loans |
|
2,297 |
|
|
|
1,253 |
|
Principal payments on debt, notes, and term loans |
|
(2,076 |
) |
|
|
(1,099 |
) |
Repurchase of common stock |
|
(175 |
) |
|
|
(140 |
) |
Dividends paid to shareholders |
|
(78 |
) |
|
|
(78 |
) |
Net share settlement of incentive equity awards |
|
(17 |
) |
|
|
(13 |
) |
Debt issuance/modification costs |
|
(15 |
) |
|
|
(12 |
) |
Proceeds from issuance of common stock |
|
11 |
|
|
|
7 |
|
Other, net |
|
— |
|
|
|
(1 |
) |
Net cash used in financing activities |
|
(172 |
) |
|
|
(255 |
) |
Effect of changes in exchange rates on cash, cash equivalents and restricted cash |
|
3 |
|
|
|
8 |
|
Net change in cash, cash equivalents and restricted cash |
|
45 |
|
|
|
58 |
|
Cash, cash equivalents and restricted cash, beginning of period |
|
426 |
|
|
|
329 |
|
Cash, cash equivalents and restricted cash, end of period |
|
471 |
|
|
|
387 |
|
Less: Restricted cash |
|
189 |
|
|
|
175 |
|
Cash and cash equivalents |
$ |
282 |
|
|
$ |
212 |
|
Table 4 |
|||||||||||||||||||||
Travel + Leisure Co. Summary Data Sheet (in millions, except per share amounts, unless otherwise indicated) |
|||||||||||||||||||||
|
Three Months Ended June 30, |
|
Six Months Ended June 30, |
||||||||||||||||||
|
|
2026 |
|
|
|
2025 |
|
|
Change |
|
|
2026 |
|
|
|
2025 |
|
|
Change |
||
Consolidated Results |
|
|
|
|
|
|
|
|
|
|
|
||||||||||
|
|
|
|
|
|
|
|
|
|
|
|
||||||||||
Net income attributable to TNL shareholders |
$ |
109 |
|
|
$ |
108 |
|
|
1 |
% |
|
$ |
188 |
|
|
$ |
181 |
|
|
4 |
% |
Diluted earnings per share |
$ |
1.72 |
|
|
$ |
1.62 |
|
|
6 |
% |
|
$ |
2.94 |
|
|
$ |
2.68 |
|
|
10 |
% |
|
|
|
|
|
|
|
|
|
|
|
|
||||||||||
Net income margin |
|
10.3 |
% |
|
|
10.6 |
% |
|
|
|
|
9.3 |
% |
|
|
9.3 |
% |
|
|
||
|
|
|
|
|
|
|
|
|
|
|
|
||||||||||
Adjusted Earnings |
|
|
|
|
|
|
|
|
|
|
|||||||||||
Adjusted EBITDA |
$ |
269 |
|
|
$ |
250 |
|
|
8 |
% |
|
$ |
494 |
|
|
$ |
452 |
|
|
9 |
% |
Adjusted net income |
$ |
119 |
|
|
$ |
110 |
|
|
8 |
% |
|
$ |
212 |
|
|
$ |
185 |
|
|
15 |
% |
Adjusted diluted earnings per share |
$ |
1.88 |
|
|
$ |
1.65 |
|
|
14 |
% |
|
$ |
3.32 |
|
|
$ |
2.75 |
|
|
21 |
% |
|
|
|
|
|
|
|
|
|
|
|
|
||||||||||
Segment Results |
|
|
|
|
|
|
|
|
|
|
|
||||||||||
|
|
|
|
|
|
|
|
|
|
|
|
||||||||||
Net Revenues |
|
|
|
|
|
|
|
|
|
|
|
||||||||||
Vacation Ownership |
$ |
907 |
|
|
$ |
853 |
|
|
6 |
% |
|
$ |
1,705 |
|
|
$ |
1,609 |
|
|
6 |
% |
Travel and Membership |
|
157 |
|
|
|
166 |
|
|
(5 |
)% |
|
|
321 |
|
|
|
345 |
|
|
(7 |
)% |
Corporate and other |
|
(1 |
) |
|
|
(1 |
) |
|
|
|
|
(2 |
) |
|
|
(3 |
) |
|
|
||
Total |
$ |
1,063 |
|
|
$ |
1,018 |
|
|
4 |
% |
|
$ |
2,024 |
|
|
$ |
1,951 |
|
|
4 |
% |
|
|
|
|
|
|
|
|
|
|
|
|
||||||||||
Adjusted EBITDA |
|
|
|
|
|
|
|
|
|
|
|
||||||||||
Vacation Ownership |
$ |
247 |
|
|
$ |
218 |
|
|
13 |
% |
|
$ |
438 |
|
|
$ |
378 |
|
|
16 |
% |
Travel and Membership |
|
49 |
|
|
|
55 |
|
|
(11 |
)% |
|
|
108 |
|
|
|
123 |
|
|
(12 |
)% |
Segment Adjusted EBITDA |
|
296 |
|
|
|
273 |
|
|
|
|
|
546 |
|
|
|
501 |
|
|
|
||
Corporate and other |
|
(27 |
) |
|
|
(23 |
) |
|
|
|
|
(52 |
) |
|
|
(49 |
) |
|
|
||
Total Adjusted EBITDA |
$ |
269 |
|
|
$ |
250 |
|
|
8 |
% |
|
$ |
494 |
|
|
$ |
452 |
|
|
9 |
% |
|
|
|
|
|
|
|
|
|
|
|
|
||||||||||
Adjusted EBITDA margin |
|
25.3 |
% |
|
|
24.6 |
% |
|
|
|
|
24.4 |
% |
|
|
23.2 |
% |
|
|
||
Note: Amounts may not calculate due to rounding. See "Presentation of Financial Information" and Table 7 for Non-GAAP definitions. For a full reconciliation of non-GAAP financial measures to the most directly comparable GAAP financial measures, refer to Table 5. |
|||||||||||||||||||||
Table 4 (continued) |
|||||||||||||||||
Travel + Leisure Co. Summary Data Sheet (in millions, unless otherwise indicated) |
|||||||||||||||||
|
Three Months Ended June 30, |
|
Six Months Ended June 30, |
||||||||||||||
|
2026 |
|
2025 |
|
Change |
|
2026 |
|
2025 |
|
Change |
||||||
Vacation Ownership |
|
|
|
|
|
|
|
|
|
|
|
||||||
|
|
|
|
|
|
|
|
|
|
|
|
||||||
Net VOI sales |
$ |
524 |
|
$ |
474 |
|
11 |
% |
|
$ |
951 |
|
$ |
858 |
|
11 |
% |
Loan loss provision |
|
141 |
|
|
128 |
|
10 |
% |
|
|
241 |
|
|
219 |
|
10 |
% |
Gross VOI sales, net of Fee-for-Service sales |
|
665 |
|
|
602 |
|
10 |
% |
|
|
1,192 |
|
|
1,077 |
|
11 |
% |
Fee-for-Service sales |
|
28 |
|
|
52 |
|
(46 |
)% |
|
|
51 |
|
|
89 |
|
(43 |
)% |
Gross VOI sales |
$ |
693 |
|
$ |
654 |
|
6 |
% |
|
$ |
1,243 |
|
$ |
1,166 |
|
7 |
% |
|
|
|
|
|
|
|
|
|
|
|
|
||||||
Tours (in thousands) |
|
200 |
|
|
197 |
|
1 |
% |
|
|
361 |
|
|
350 |
|
3 |
% |
VPG (in dollars) |
$ |
3,318 |
|
$ |
3,251 |
|
2 |
% |
|
$ |
3,319 |
|
$ |
3,234 |
|
3 |
% |
|
|
|
|
|
|
|
|
|
|
|
|
||||||
Tour generated VOI sales |
$ |
663 |
|
$ |
641 |
|
4 |
% |
|
$ |
1,197 |
|
$ |
1,133 |
|
6 |
% |
Telesales and other |
|
30 |
|
|
13 |
|
128 |
% |
|
|
46 |
|
|
33 |
|
40 |
% |
Gross VOI sales |
$ |
693 |
|
$ |
654 |
|
6 |
% |
|
$ |
1,243 |
|
$ |
1,166 |
|
7 |
% |
|
|
|
|
|
|
|
|
|
|
|
|
||||||
Net VOI sales |
$ |
524 |
|
$ |
474 |
|
11 |
% |
|
$ |
951 |
|
$ |
858 |
|
11 |
% |
Property management revenue |
|
230 |
|
|
217 |
|
6 |
% |
|
|
452 |
|
|
440 |
|
3 |
% |
Consumer financing |
|
113 |
|
|
112 |
|
1 |
% |
|
|
226 |
|
|
224 |
|
1 |
% |
Other (a) |
|
40 |
|
|
50 |
|
(20 |
)% |
|
|
76 |
|
|
87 |
|
(13 |
)% |
Total Vacation Ownership revenue |
$ |
907 |
|
$ |
853 |
|
6 |
% |
|
$ |
1,705 |
|
$ |
1,609 |
|
6 |
% |
|
|
|
|
|
|
|
|
|
|
|
|
||||||
Travel and Membership |
|
|
|
|
|
|
|
|
|
|
|
||||||
|
|
|
|
|
|
|
|
|
|
|
|
||||||
Avg. number of exchange members (in thousands) |
|
3,275 |
|
|
3,329 |
|
(2 |
)% |
|
|
3,283 |
|
|
3,346 |
|
(2 |
)% |
|
|
|
|
|
|
|
|
|
|
|
|
||||||
Transactions (in thousands) |
|
171 |
|
|
197 |
|
(13 |
)% |
|
|
381 |
|
|
437 |
|
(13 |
)% |
Revenue per transaction (in dollars) |
$ |
369 |
|
$ |
370 |
|
— |
% |
|
$ |
359 |
|
$ |
361 |
|
— |
% |
Exchange transaction revenue |
$ |
63 |
|
$ |
73 |
|
(14 |
)% |
|
$ |
137 |
|
$ |
157 |
|
(13 |
)% |
|
|
|
|
|
|
|
|
|
|
|
|
||||||
Transactions (in thousands) |
|
242 |
|
|
191 |
|
27 |
% |
|
|
448 |
|
|
367 |
|
22 |
% |
Revenue per transaction (in dollars) |
$ |
189 |
|
$ |
229 |
|
(17 |
)% |
|
$ |
197 |
|
$ |
242 |
|
(18 |
)% |
Travel Club transaction revenue |
$ |
46 |
|
$ |
44 |
|
5 |
% |
|
$ |
88 |
|
$ |
89 |
|
(1 |
)% |
|
|
|
|
|
|
|
|
|
|
|
|
||||||
Transactions (in thousands) |
|
413 |
|
|
388 |
|
6 |
% |
|
|
829 |
|
|
804 |
|
3 |
% |
Revenue per transaction (in dollars) |
$ |
263 |
|
$ |
300 |
|
(12 |
)% |
|
$ |
272 |
|
$ |
306 |
|
(11 |
)% |
Travel and Membership transaction revenue |
$ |
109 |
|
$ |
117 |
|
(7 |
)% |
|
$ |
225 |
|
$ |
246 |
|
(9 |
)% |
|
|
|
|
|
|
|
|
|
|
|
|
||||||
Transaction revenue |
$ |
109 |
|
$ |
117 |
|
(7 |
)% |
|
$ |
225 |
|
$ |
246 |
|
(9 |
)% |
Subscription revenue |
|
42 |
|
|
43 |
|
(2 |
)% |
|
|
84 |
|
|
86 |
|
(2 |
)% |
Other (b) |
|
6 |
|
|
6 |
|
— |
% |
|
|
12 |
|
|
13 |
|
(8 |
)% |
Total Travel and Membership revenue |
$ |
157 |
|
$ |
166 |
|
(5 |
)% |
|
$ |
321 |
|
$ |
345 |
|
(7 |
)% |
Note: Amounts may not compute due to rounding. |
|||||||||||||||||
(a) Includes Fee-for-Service commission revenues and other ancillary revenues. |
|||||||||||||||||
(b) Primarily related to cancellation fees, commissions, and other ancillary revenue. |
|||||||||||||||||
Table 5 |
|||||||||||||||||||
Travel + Leisure Co. Non-GAAP Measure: Reconciliation of Net Income to Adjusted Net Income to Adjusted EBITDA (in millions, except diluted per share amounts) |
|||||||||||||||||||
|
Three Months Ended June 30, |
||||||||||||||||||
2026 |
EPS |
Margin % |
2025 |
EPS |
|
Margin % |
|||||||||||||
Net income attributable to TNL shareholders |
$ |
109 |
|
|
$ |
1.72 |
|
10.3 |
% |
|
$ |
108 |
|
|
$ |
1.62 |
|
10.6 |
% |
Inventory write-downs and asset impairments, net (a) |
|
6 |
|
|
|
|
|
|
|
1 |
|
|
|
|
|
||||
Other (b) |
|
4 |
|
|
|
|
|
|
|
— |
|
|
|
|
|
||||
Amortization of acquired intangibles (c) |
|
2 |
|
|
|
|
|
|
|
3 |
|
|
|
|
|
||||
Debt modification (d) |
|
2 |
|
|
|
|
|
|
|
— |
|
|
|
|
|
||||
Acquisition-related deal costs |
|
1 |
|
|
|
|
|
|
|
— |
|
|
|
|
|
||||
Legacy items |
|
(1 |
) |
|
|
|
|
|
|
(1 |
) |
|
|
|
|
||||
Taxes (e) |
|
(4 |
) |
|
|
|
|
|
|
(1 |
) |
|
|
|
|
||||
Adjusted net income |
$ |
119 |
|
|
$ |
1.88 |
|
11.2 |
% |
|
$ |
110 |
|
|
$ |
1.65 |
|
10.8 |
% |
Income taxes on adjusted net income |
|
50 |
|
|
|
|
|
|
|
45 |
|
|
|
|
|
||||
Interest expense (f) |
|
59 |
|
|
|
|
|
|
|
57 |
|
|
|
|
|
||||
Depreciation |
|
30 |
|
|
|
|
|
|
|
28 |
|
|
|
|
|
||||
Stock-based compensation expense (g) |
|
15 |
|
|
|
|
|
|
|
12 |
|
|
|
|
|
||||
Debt modification |
|
(2 |
) |
|
|
|
|
|
|
— |
|
|
|
|
|
||||
Interest income |
|
(2 |
) |
|
|
|
|
|
|
(2 |
) |
|
|
|
|
||||
Adjusted EBITDA |
$ |
269 |
|
|
|
|
25.3 |
% |
|
$ |
250 |
|
|
|
|
24.6 |
% |
||
|
|
|
|
|
|
|
|
|
|
|
|
||||||||
Diluted Shares Outstanding |
|
63.4 |
|
|
|
|
|
|
|
66.5 |
|
|
|
|
|
||||
|
|
|
|
|
|
|
|
|
|
|
|
||||||||
|
Six Months Ended June 30, |
||||||||||||||||||
|
2026 |
|
EPS |
|
Margin % |
|
2025 |
|
EPS |
|
Margin % |
||||||||
Net income attributable to TNL shareholders |
$ |
188 |
|
|
$ |
2.94 |
|
9.3 |
% |
|
$ |
181 |
|
|
$ |
2.68 |
|
9.3 |
% |
Inventory write-downs and asset impairments, net (a) |
|
25 |
|
|
|
|
|
|
|
1 |
|
|
|
|
|
||||
Other (b) |
|
9 |
|
|
|
|
|
|
|
— |
|
|
|
|
|
||||
Amortization of acquired intangibles (c) |
|
5 |
|
|
|
|
|
|
|
5 |
|
|
|
|
|
||||
Debt modification (d) |
|
2 |
|
|
|
|
|
|
|
— |
|
|
|
|
|
||||
Acquisition-related deal costs |
|
1 |
|
|
|
|
|
|
|
— |
|
|
|
|
|
||||
Restructuring |
|
(2 |
) |
|
|
|
|
|
|
— |
|
|
|
|
|
||||
Legacy items |
|
(5 |
) |
|
|
|
|
|
|
— |
|
|
|
|
|
||||
Taxes (e) |
|
(10 |
) |
|
|
|
|
|
|
(2 |
) |
|
|
|
|
||||
Adjusted net income |
$ |
212 |
|
|
$ |
3.32 |
|
10.5 |
% |
|
$ |
185 |
|
|
$ |
2.75 |
|
9.5 |
% |
Income taxes on adjusted net income |
|
85 |
|
|
|
|
|
|
|
74 |
|
|
|
|
|
||||
Interest expense (f) |
|
115 |
|
|
|
|
|
|
|
115 |
|
|
|
|
|
||||
Depreciation |
|
59 |
|
|
|
|
|
|
|
56 |
|
|
|
|
|
||||
Stock-based compensation expense (g) |
|
29 |
|
|
|
|
|
|
|
26 |
|
|
|
|
|
||||
Debt modification |
|
(2 |
) |
|
|
|
|
|
|
— |
|
|
|
|
|
||||
Interest income |
|
(5 |
) |
|
|
|
|
|
|
(4 |
) |
|
|
|
|
||||
Adjusted EBITDA |
$ |
494 |
|
|
|
|
24.4 |
% |
|
$ |
452 |
|
|
|
|
23.2 |
% |
||
|
|
|
|
|
|
|
|
|
|
|
|
||||||||
Diluted Shares Outstanding |
|
64.0 |
|
|
|
|
|
|
|
67.3 |
|
|
|
|
|
||||
Table 5 (continued) |
||
| Amounts may not calculate due to rounding. The tables above reconcile certain non-GAAP financial measures to their closest GAAP measure. The presentation of these adjustments is intended to permit the comparison of particular adjustments as they appear in the income statement in order to assist investors' understanding of the overall impact of such adjustments. In addition to GAAP financial measures, the Company provides Adjusted net income, Adjusted EBITDA, Adjusted EBITDA margin, and Adjusted diluted EPS to assist our investors in evaluating our ongoing operating performance for the current reporting period and, where provided, over different reporting periods, by adjusting for certain items which in our view do not necessarily reflect ongoing performance. We also internally use these measures to assess our operating performance, both absolutely and in comparison to other companies, and in evaluating or making selected compensation decisions. These supplemental disclosures are in addition to GAAP reported measures. Non-GAAP measures should not be considered a substitute for, nor superior to, financial results and measures determined or calculated in accordance with GAAP. Our presentation of adjusted measures may not be comparable to similarly-titled measures used by other companies. See "Presentation of Financial Information" and Table 7 for the definitions of these non-GAAP measures. | ||
(a) |
Includes $6 million and $25 million inventory write-downs and impairments related to the Company's resort optimization initiative for the three and six months ended June 30, 2026, which are included within Cost of vacation ownership interests on the Condensed Consolidated Statements of Income. |
|
(b) |
Includes $3 million and $8 million of resort closure and other employee related costs associated with the resort optimization initiative for the three and six months ended June 30, 2026, which are included within Operating expense on the Condensed Consolidated Statements of Income, and $1 million of other items that meet the conditions of unusual and/or infrequent for both the three and six months ended June 30, 2026. |
|
(c) |
Amortization of acquisition-related intangible assets is excluded from Adjusted net income and Adjusted EBITDA. |
|
(d) |
Debt modification costs are excluded from Adjusted net income. |
|
(e) |
Represents the tax effects on the adjustments. We determine the tax effects of the non-GAAP adjustments based on the nature of the underlying adjustment and the relevant tax jurisdictions. The tax effect of the non-GAAP adjustments was calculated based on an evaluation of the statutory tax treatment and the applicable statutory tax rate in the relevant jurisdictions. |
|
(f) |
Includes $2 million of debt modification costs associated with refinancing of the $650 million 6.625% secured notes due July 2026 during both the three and six months ended June 30, 2026. |
|
(g) |
All stock-based compensation related costs are excluded from Adjusted EBITDA. |
|
Table 6 |
|||||||
Travel + Leisure Co. Non-GAAP Measure: Reconciliation of Net Cash Provided by Operating Activities to Adjusted Free Cash Flow (in millions) |
|||||||
|
Six Months Ended June 30, |
||||||
|
|
2026 |
|
|
|
2025 |
|
|
|
|
|
||||
Net cash provided by operating activities |
$ |
258 |
|
|
$ |
353 |
|
Property and equipment additions |
|
(44 |
) |
|
|
(58 |
) |
Sum of proceeds and principal payments of non-recourse vacation ownership debt |
|
(119 |
) |
|
|
(172 |
) |
Free cash flow / Adjusted free cash flow (a) |
$ |
95 |
|
|
$ |
123 |
|
(a) |
The Company had $44 million and $48 million of net cash used in investing activities during the six months ended June 30, 2026 and 2025. The Company had $172 million and $255 million of net cash used in financing activities for the six months ended June 30, 2026, and 2025. |
|
Table 7 |
Definitions
Adjusted Diluted Earnings per Share: A non-GAAP measure, defined by the Company as Adjusted net income divided by the diluted weighted average number of common shares. Adjusted Diluted Earnings per Share is useful to assist our investors in evaluating our ongoing operating performance for the current reporting period and, where provided, over different reporting periods.
Adjusted EBITDA: A non-GAAP measure, defined by the Company as net income from continuing operations before depreciation and amortization, interest expense (excluding consumer financing interest), early extinguishment of debt, interest income (excluding consumer financing revenues) and income taxes, each of which is presented on the Condensed Consolidated Statements of Income. Adjusted EBITDA also excludes stock-based compensation costs, separation and restructuring costs, legacy items, transaction and integration costs associated with mergers, acquisitions, and divestitures, asset impairments/recoveries and inventory write-downs associated with the Company’s resort optimization initiative, gains and losses on sale/disposition of business, and items that meet the conditions of unusual and/or infrequent. Legacy items include the resolution of and adjustments to certain contingent assets and liabilities related to acquisitions of continuing businesses and dispositions, including the separation of Wyndham Hotels & Resorts, Inc. and Avis Budget Group, Inc. (ABG), and the sale of the vacation rentals businesses. Integration costs represent certain non-recurring costs directly incurred to integrate mergers and/or acquisitions into the existing business. We believe that when considered with GAAP measures, Adjusted EBITDA is useful to assist our investors in evaluating our ongoing operating performance for the current reporting period and, where provided, over different reporting periods. We also internally use this measure to assess our operating performance, both absolutely and in comparison to other companies, and in evaluating or making selected compensation decisions. Adjusted EBITDA should not be considered in isolation or as a substitute for net income/(loss) or other income statement data prepared in accordance with GAAP and our presentation of Adjusted EBITDA may not be comparable to similarly-titled measures used by other companies.
Adjusted EBITDA Margin: A non-GAAP measure, represents Adjusted EBITDA as a percentage of revenue. Adjusted EBITDA Margin is useful to assist our investors in evaluating our ongoing operating performance for the current reporting period and, where provided, over different reporting periods.
Adjusted Free Cash Flow: A non-GAAP measure, defined by the Company as net cash provided by operating activities from continuing operations less property and equipment additions (capital expenditures) plus the sum of proceeds and principal payments of non-recourse vacation ownership debt, while also adding back cash paid for transaction costs for acquisitions and divestitures, separation adjustments associated with the spin-off of Wyndham Hotels, and certain adjustments related to COVID-19. TNL believes adjusted FCF to be a useful operating performance measure to evaluate the ability of its operations to generate cash for uses other than capital expenditures and, after debt service and other obligations, its ability to grow its business through acquisitions and equity investments, as well as its ability to return cash to shareholders through dividends and share repurchases. A limitation of using Adjusted free cash flow versus the GAAP measure of net cash provided by operating activities as a means for evaluating TNL is that Adjusted free cash flow does not represent the total cash movement for the period as detailed in the consolidated statement of cash flows.
Adjusted Net Income: A non-GAAP measure, defined by the Company as net income from continuing operations adjusted to exclude separation and restructuring costs, legacy items, transaction and integration costs associated with mergers, acquisitions, and divestitures, amortization of acquisition-related assets, debt modification costs, impairments and inventory write-downs associated with the Company’s resort optimization initiative, gains and losses on sale/disposition of business, and items that meet the conditions of unusual and/or infrequent and the tax effect of such adjustments. Legacy items include the resolution of and adjustments to certain contingent assets and liabilities related to acquisitions of continuing businesses and dispositions, including the separation of Wyndham Hotels and ABG, and the sale of the vacation rentals businesses. We believe Adjusted Net Income is useful to assist our investors in evaluating our ongoing operating performance for the current reporting period and, where provided, over different reporting periods.
Average Number of Exchange Members: Represents the average number of paid members in our vacation exchange programs who are considered to be in good standing, during a given reporting period.
Free Cash Flow (FCF): A non-GAAP measure, defined by TNL as net cash provided by operating activities from continuing operations less property and equipment additions (capital expenditures) plus the sum of proceeds and principal payments of non-recourse vacation ownership debt. TNL believes FCF to be a useful operating performance measure to evaluate the ability of its operations to generate cash for uses other than capital expenditures and, after debt service and other obligations, its ability to grow its business through acquisitions and equity investments, as well as its ability to return cash to shareholders through dividends and share repurchases. A limitation of using FCF versus the GAAP measure of net cash provided by operating activities as a means for evaluating TNL is that FCF does not represent the total cash movement for the period as detailed in the consolidated statement of cash flows.
Gross Vacation Ownership Interest Sales: A non-GAAP measure, represents sales of vacation ownership interests (VOIs), including sales under the Fee-for-Service program before the effect of loan loss provisions. We believe that Gross VOI sales provide an enhanced understanding of the performance of our vacation ownership business because it directly measures the sales volume of this business during a given reporting period.
Leverage Ratio: The Company calculates leverage ratio as net debt divided by Adjusted EBITDA as defined in the credit agreement.
Net Debt: Net debt equals total debt outstanding, less non-recourse vacation ownership debt and cash and cash equivalents.
Tours: Represents the number of tours taken by guests in our efforts to sell VOIs.
Travel and Membership Revenue per Transaction: Represents transaction revenue divided by transactions, provided in two categories; Exchange, which is primarily RCI, and Travel Club.
Travel and Membership Transactions: Represents the number of exchanges and travel bookings recognized as revenue during the period, net of cancellations. This measure is provided in two categories; Exchange, which is primarily RCI, and Travel Club.
Volume Per Guest (VPG): Represents Gross VOI sales (excluding telesales and virtual sales) divided by the number of tours. The Company has excluded non-tour sales in the calculation of VPG because non-tour sales are generated by a different marketing channel. We believe that VPG provides an enhanced understanding of the performance of our Vacation Ownership business because it directly measures the efficiency of its tour selling efforts during a given reporting period.
Contacts
Investors:
Andrew Burns
Investor Relations
IR@travelandleisure.com
Media:
Jessica Doyle
Public Relations
Media@travelandleisure.com