

Newsroom
Sorted by: Latest
-
First Trust Global Funds PLC UK Regulatory Announcement: Net Asset Value(s)
LONDON--(BUSINESS WIRE)-- Funds Date TIDM ISIN Code Shares in Issue Currency Net Asset Value NAV/per Share First Trust Capital Strength UCITS ETF 14.05.2026 FTCS. IE00BL0L0D23 300,002.00 USD 9,675,347.35 32.251 ...
-
Oasis Submits Shareholder Proposals for Kyocera AGM, Urging Transformation and Removal of Chairman Yamaguchi
HONG KONG--(BUSINESS WIRE)--Oasis Management Company Ltd. (“Oasis”) is the manager to funds that beneficially own shares in Kyocera Corporation (6971 JP) (“Kyocera” or the “Company”). Oasis is a long-term shareholder of Kyocera, having been an engaged shareholder of Kyocera since 2015. Oasis has adopted the Japan FSA’s “Principles of Responsible Institutional Investors” (a.k.a. the Japan Stewardship Code) and in line with those principles, Oasis monitors and engages with its investee companies....
-
オアシス、京セラの真の変革に向け山口会長の解任を含む株主提案を提出
香港--(BUSINESS WIRE)--(ビジネスワイヤ) -- オアシス・マネジメント・カンパニー・リミテッド(以下「オアシス」または「当社」)は、京セラ株式会社(6971 JP)(以下「京セラ」または「同社」)の株式を保有するファンドの運用会社です。オアシスは、2015年に京セラに投資をして以来、京セラの長期株主としてエンゲージメント活動を行ってきました。オアシスは、金融庁の「責任ある機関投資家のための原則」(日本版スチュワードシップ・コード)に準拠し、この原則に沿って投資先企業をモニタリングし、投資先企業と対話を行っています。 オアシスは、「より強い京セラ」キャンペーンの一環として、京セラに対し大胆な変革を求めてきました。これを受けて京セラは一定の対応は示しているものの、その進捗はあまりに限定的であり、同社が過去の姿にとらわれたままであることを示しています。京セラの変革の実現に向け、オアシスは2026年6月に開催予定の株主総会に向け、①2027年3月期における3,500億円の自社株買いの実施、②山口会長の解任、③岡村宏太郎氏の社外取締役選任を求める株主提案を提出しました。 議...
-
First Trust Global Funds PLC UK Regulatory Announcement: Net Asset Value(s)
LONDON--(BUSINESS WIRE)-- Funds Date TIDM ISIN Code Shares in Issue Currency Net Asset Value NAV/per Share First Trust Value Line Dividend Index UCITS ETF 14.05.2026 FVD. IE00BKVKW020 250,002.00 USD 7,177,567.95 28.710 ...
-
First Trust Global Funds PLC UK Regulatory Announcement: Net Asset Value(s)
LONDON--(BUSINESS WIRE)-- Funds Date TIDM ISIN Code Shares in Issue Currency Net Asset Value NAV/per Share First Trust Global Capital Strength ESG Leaders UCITS ETF 14.05.2026 FCSG IE00BKPSPT20 1,025,002.00 USD 43,998,447.44 42.925 ...
-
MUFG Bank, Ltd. UK Regulatory Announcement: Final Results
TOKYO--(BUSINESS WIRE)-- MUFG Bank, Ltd. announces Consolidated Summary Report <under Japanese GAAP> for the fiscal year ended March 31, 2026 May 15, 2026 Company name: Mitsubishi UFJ Financial Group, Inc. Stock exchange listings: Tokyo, Nagoya, New York Code number: 8306 URL https://www.mufg.jp/english/ Representative: Junichi Hanzawa, President & Group CEO For inquiry: Masahisa Takahashi, Managing Director, Head of Financial Accounting and Reporting, Financial Accounting Office, Fi...
-
First Trust Global Funds PLC UK Regulatory Announcement: Net Asset Value(s)
LONDON--(BUSINESS WIRE)-- Funds Date TIDM ISIN Code Shares in Issue Currency Net Asset Value NAV/per Share First Trust FactorFX UCITS ETF 14.05.2026 FXGB LN IE00BD5HBR05 37,992.00 GBP 765,537.41 27.171 ...
-
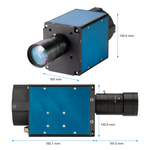
Teledyne Introduces Kaleido SWIR Hyperspectral Camera for High‑Speed Industrial Inspection
WATERLOO, Ontario--(BUSINESS WIRE)--Teledyne DALSA, a global leader in machine vision, today announced Kaleido™, a groundbreaking short‑wave infrared (SWIR) hyperspectral camera. Engineered to overcome the integration and performance barriers of industrial sorting, Kaleido targets critical applications in recycling, food safety, pharmaceuticals, and waste management. By significantly advancing material discrimination and increasing throughput, Kaleido redefines the cost-to-performance ratio for...
-
オムディア (Omdia)、デスクトップモニター出荷台数、ゲーミングモニターが回復を牽引し2025年に1億3,340万台に到達と発表
英ロンドン--(BUSINESS WIRE)--(ビジネスワイヤ) -- 2025年のデスクトップ・モニター出荷台数は前年比4.3%増の1億3,340万台を記録し、パンデミック後の停滞から回復の兆しを見せた。この拡大は、ノートPC主流の環境において、モニターが多用途で高付加価値なツールへと進化していることを反映しており、ゲーミング分野が高性能ディスプレイへの関心を促進している。 ゲーミングモニターの出荷台数は、費用対効果の向上と機能の拡充を背景に、2026年には4,300万台に達すると予測されている。このトレンドは、専門的な消費者向けアプリケーションと没入型エンターテインメント体験へのシフトを反映している。 ゲーミングモニターが全体の出荷拡大を牽引 2025年のグローバルゲーミングモニター出荷台数は4,100万台に達し、前年比50.2%増となった。2025年第4四半期には、ゲーミングモニターの出荷台数は11四半期連続で増加し、オムディ(Omdia)の調査開始以降で最高水準を達した。こうした数値は、従来型モニター市場の成長率を大きく上回り、ゲーミングモニターを顕著な成長セグメントとして...
-
Omdia:2025年桌面显示面板出货量达1.334亿台,电竞显示面板拉动市场复苏
伦敦--(BUSINESS WIRE)--(美国商业资讯)-- 2025年桌面显示面板出货量达到1.334亿台,同比增长4.3%,标志着市场从疫情后的行业波动中实现复苏。这一增长反映了显示面板向多功能、高价值工具的演变,尤其是在以笔记本电脑为主导的环境中,而游戏需求也带动了市场对高性能显示屏的关注。 得益于性价比提升和功能增加,电竞显示面板2026年出货量预计将增至4300万台。该趋势体现出市场向专业消费应用和沉浸式娱乐体验的转变。 电竞显示面板拉动整体出货量增长 2025年全球电竞显示面板出货量达4100万台,同比增长50.2%,电竞显示面板占桌面显示面板总出货量的31.1%。2025年第四季度,电竞显示面板出货量实现连续第十一个季度增长,创下Omdia追踪数据以来的最高水平。该数据大幅领先传统显示面板市场的的增速,使电竞显示面板成为核心增长细分品类。 市场增长动力源于附加值提升和功能升级。刷新率120赫兹以上的机型热度快速上升,同时响应速度和屏幕尺寸的提升也符合现代电竞内容不断变化的需求。 Omdia高级首席分析师Hidetoshi Himuro表示:“电竞显示面板预计将紧跟中央处...
