

Kimball Electronics Reports Q3 Results With Record Revenue and Expanding Operating Margin; Company Updates Outlook for Fiscal Year 2023 With Sales Expected at the High-End and Adjusted Operating Margin in the Mid-to-Low End of Its Guidance Range
Kimball Electronics Reports Q3 Results With Record Revenue and Expanding Operating Margin; Company Updates Outlook for Fiscal Year 2023 With Sales Expected at the High-End and Adjusted Operating Margin in the Mid-to-Low End of Its Guidance Range
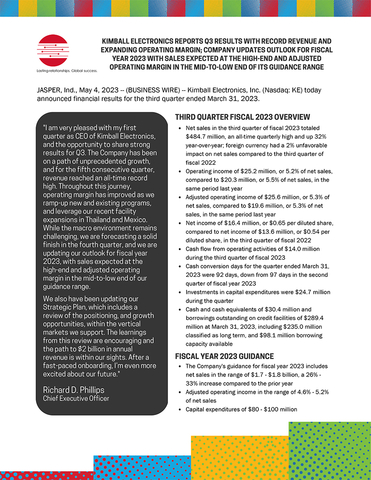
- Net sales in the third quarter of fiscal 2023 totaled $484.7 million, an all-time quarterly high and up 32% year-over-year; foreign currency had a 2% unfavorable impact on net sales compared to the third quarter of fiscal 2022
- Operating income of $25.2 million, or 5.2% of net sales, compared to $20.3 million, or 5.5% of net sales, in the same period last year
- Adjusted operating income of $25.6 million, or 5.3% of net sales, compared to $19.6 million, or 5.3% of net sales, in the same period last year
- Net income of $16.4 million, or $0.65 per diluted share, compared to net income of $13.6 million, or $0.54 per diluted share, in the third quarter of fiscal 2022
JASPER, Ind.--(BUSINESS WIRE)--Kimball Electronics, Inc. (Nasdaq: KE) today announced financial results for the third quarter ended March 31, 2023.
|
Three Months Ended |
|
Nine Months Ended |
||||||||||||
|
March 31, |
|
March 31, |
||||||||||||
(Amounts in Thousands, except EPS) |
2023 |
|
2022 |
|
2023 |
|
2022 |
||||||||
Net Sales |
$ |
484,703 |
|
|
$ |
368,057 |
|
|
$ |
1,327,288 |
|
|
$ |
976,038 |
|
Operating Income |
$ |
25,220 |
|
|
$ |
20,277 |
|
|
$ |
56,280 |
|
|
$ |
31,971 |
|
Adjusted Operating Income (non-GAAP) (1) |
$ |
25,573 |
|
|
$ |
19,558 |
|
|
$ |
56,738 |
|
|
$ |
30,183 |
|
Operating Income % |
|
5.2 |
% |
|
|
5.5 |
% |
|
|
4.2 |
% |
|
|
3.3 |
% |
Adjusted Operating Income (non-GAAP) % |
|
5.3 |
% |
|
|
5.3 |
% |
|
|
4.3 |
% |
|
|
3.1 |
% |
Net Income |
$ |
16,400 |
|
|
$ |
13,638 |
|
|
$ |
36,629 |
|
|
$ |
21,315 |
|
Adjusted Net Income (non-GAAP) (1) |
$ |
16,400 |
|
|
$ |
13,638 |
|
|
$ |
36,908 |
|
|
$ |
20,265 |
|
Diluted EPS |
$ |
0.65 |
|
|
$ |
0.54 |
|
|
$ |
1.46 |
|
|
$ |
0.84 |
|
Adjusted Diluted EPS (non-GAAP) (1) |
$ |
0.65 |
|
|
$ |
0.54 |
|
|
$ |
1.47 |
|
|
$ |
0.80 |
|
(1) A reconciliation of GAAP and non-GAAP financial measures is included below. |
|||||||||||||||
Richard D. Phillips, Chief Executive Officer, stated, “I am very pleased with my first quarter as CEO of Kimball Electronics, and the opportunity to share strong results for Q3. The Company has been on a path of unprecedented growth, and for the fifth consecutive quarter, revenue reached an all-time record high. Throughout this journey, operating margin has improved as we ramp-up new and existing programs, and leverage our recent facility expansions in Thailand and Mexico. While the macro environment remains challenging, we are forecasting a solid finish in the fourth quarter, and we are updating our outlook for fiscal year 2023, with sales expected at the high-end and adjusted operating margin in the mid-to-low end of our guidance range.”
Mr. Phillips continued, “We also have been updating our Strategic Plan, which includes a review of the positioning, and growth opportunities, within the vertical markets we support. The learnings from this review are encouraging and the path to $2 billion in annual revenue is within our sights. After a fast-paced onboarding, I’m even more excited about our future.”
As a reminder, the Company’s guidance for fiscal year 2023 includes net sales in the range of $1.7 - $1.8 billion, a 26% - 33% increase compared to the prior year; adjusted operating income in the range of 4.6% - 5.2% of net sales; and capital expenditures of $80 - $100 million.
Third Quarter Fiscal 2023 Overview
- Cash flow from operating activities of $14.0 million during the third quarter of fiscal 2023
- Cash conversion days (“CCD”) for the quarter ended March 31, 2023 were 92 days, down from 97 days in the second quarter of fiscal year 2023; CCD is calculated as the sum of days sales outstanding plus contract asset days plus production days supply on hand less accounts payable days and advances from customers days
- Investments in capital expenditures were $24.7 million during the quarter
- Cash and cash equivalents of $30.4 million and borrowings outstanding on credit facilities of $289.4 million at March 31, 2023, including $235.0 million classified as long term, and $98.1 million borrowing capacity available
Net Sales by Vertical Market for Q3 Fiscal 2023:
|
Three Months Ended |
|
|
|
Nine Months Ended |
|
|
||||||||||||||||
|
March 31, |
|
|
|
March 31, |
|
|
||||||||||||||||
(Amounts in Millions) |
2023 |
|
* |
|
2022 |
|
* |
|
Percent
|
|
2023 |
|
* |
|
2022 |
|
* |
|
Percent
|
||||
Automotive |
$ |
216.0 |
|
45% |
|
$ |
161.5 |
|
44% |
|
34% |
|
$ |
600.5 |
|
45% |
|
$ |
429.8 |
|
44% |
|
40% |
Medical |
|
134.0 |
|
28% |
|
|
102.9 |
|
28% |
|
30% |
|
|
373.5 |
|
28% |
|
|
277.7 |
|
29% |
|
34% |
Industrial (1) |
|
126.9 |
|
26% |
|
|
98.2 |
|
27% |
|
29% |
|
|
332.8 |
|
25% |
|
|
255.8 |
|
26% |
|
30% |
Other |
|
7.8 |
|
1% |
|
|
5.5 |
|
1% |
|
42% |
|
|
20.5 |
|
2% |
|
|
12.7 |
|
1% |
|
61% |
Total Net Sales |
$ |
484.7 |
|
|
|
$ |
368.1 |
|
|
|
32% |
|
$ |
1,327.3 |
|
|
|
$ |
976.0 |
|
|
|
36% |
|
|
|
|
|
|
|
|
|
|
|
|||||||||||||
* As a percent of Total Net Sales |
|||||||||||||||||||||||
(1) Beginning in fiscal year 2023, Public Safety was combined with Industrial; all prior periods have been recast to conform to current period presentation |
|||||||||||||||||||||||
|
|
|
|
|
|
|
|
|
|
|
|||||||||||||
– Automotive includes electronic power steering, body controls, automated driver assist systems, and electronic braking systems |
|||||||||||||||||||||||
– Medical includes sleep therapy and respiratory care, image guided therapy, in vitro diagnostics, drug delivery, AED, and patient monitoring |
|||||||||||||||||||||||
– Industrial includes climate controls, automation controls, optical inspection, smart metering, and public safety |
|||||||||||||||||||||||
Forward-Looking Statements
Certain statements contained within this release are considered forward-looking, including our fiscal year 2023 guidance, under the Private Securities Litigation Reform Act of 1995. The statements may be identified by the use of words such as “expect,” “should,” “goal,” “predict,” “will,” “future,” “optimistic,” “confident,” and “believe.” Undue reliance should not be placed on these forward-looking statements. These statements are based on current expectations of future events and thus are inherently subject to uncertainty. If underlying assumptions prove inaccurate or known or unknown risks or uncertainties materialize, actual results could vary materially from our expectations and projections. These forward-looking statements are subject to risks and uncertainties including, without limitation, global economic conditions, geopolitical environment and conflicts such as the war in Ukraine, global health emergencies including the COVID-19 pandemic, availability or cost of raw materials and components, foreign exchange rate fluctuations, and our ability to convert new business opportunities into customers and revenue. Additional cautionary statements regarding other risk factors that could have an effect on the future performance of the company are contained in its Annual Report on Form 10-K for the year ended June 30, 2022.
Non-GAAP Financial Measures
This press release contains non-GAAP financial measures. The non-GAAP financial measures contained herein include adjusted operating income, adjusted net income, adjusted diluted EPS, and ROIC. Reconciliations of the reported GAAP numbers to these non-GAAP financial measures are included in the Reconciliation of Non-GAAP Financial Measures section below. Management believes these measures are useful and allow investors to meaningfully trend, analyze, and benchmark the performance of the company’s core operations. The company’s non-GAAP financial measures are not necessarily comparable to non-GAAP information used by other companies.
About Kimball Electronics, Inc.
Kimball Electronics is a multifaceted manufacturing solutions provider of electronics and diversified contract manufacturing services to customers around the world. From our operations in the United States, China, India, Japan, Mexico, Poland, Romania, Thailand, and Vietnam, our teams are proud to provide manufacturing services for a variety of industries. Recognized for a reputation of excellence, we are committed to a high-performance culture that values personal and organizational commitment to quality, reliability, value, speed, and ethical behavior. Kimball Electronics, Inc. (Nasdaq: KE) is headquartered in Jasper, Indiana.
To learn more about Kimball Electronics, visit: www.kimballelectronics.com.
Conference Call / Webcast |
||
|
|
|
Date: |
|
May 5, 2023 |
Time: |
|
10:00 AM Eastern Time |
Live Webcast: |
|
investors.kimballelectronics.com/events-and-presentations/events |
Dial-In #: |
|
404-975-4839 (other locations - 833-470-1428) |
Conference ID: |
|
308984 |
For those unable to participate in the live webcast, the call will be archived at investors.kimballelectronics.com.
Lasting relationships. Global success.
Financial highlights for the third quarter and year-to-date period ended March 31, 2023 are as follows:
Condensed Consolidated Statements of Income |
|
|
|
|
|
|
|||||||
(Unaudited) |
Three Months Ended |
||||||||||||
(Amounts in Thousands, except Per Share Data) |
March 31, 2023 |
|
March 31, 2022 |
||||||||||
Net Sales |
$ |
484,703 |
|
|
100.0 |
% |
|
$ |
368,057 |
|
|
100.0 |
% |
Cost of Sales |
|
441,731 |
|
|
91.1 |
% |
|
|
334,113 |
|
|
90.8 |
% |
Gross Profit |
|
42,972 |
|
|
8.9 |
% |
|
|
33,944 |
|
|
9.2 |
% |
Selling and Administrative Expenses |
|
17,752 |
|
|
3.7 |
% |
|
|
13,667 |
|
|
3.7 |
% |
Operating Income |
|
25,220 |
|
|
5.2 |
% |
|
|
20,277 |
|
|
5.5 |
% |
Other Income (Expense), net |
|
(3,344 |
) |
|
(0.7 |
)% |
|
|
(2,103 |
) |
|
(0.6 |
)% |
Income Before Taxes on Income |
|
21,876 |
|
|
4.5 |
% |
|
|
18,174 |
|
|
4.9 |
% |
Provision for Income Taxes |
|
5,476 |
|
|
1.1 |
% |
|
|
4,536 |
|
|
1.2 |
% |
Net Income |
$ |
16,400 |
|
|
3.4 |
% |
|
$ |
13,638 |
|
|
3.7 |
% |
|
|
|
|
|
|
|
|
||||||
Earnings Per Share of Common Stock: |
|
|
|
|
|
|
|
||||||
Basic |
$ |
0.66 |
|
|
|
|
$ |
0.54 |
|
|
|
||
Diluted |
$ |
0.65 |
|
|
|
|
$ |
0.54 |
|
|
|
||
|
|
|
|
|
|
|
|
||||||
Average Number of Shares Outstanding: |
|
|
|
|
|
|
|
||||||
Basic |
|
24,898 |
|
|
|
|
|
25,175 |
|
|
|
||
Diluted |
|
25,067 |
|
|
|
|
|
25,272 |
|
|
|
||
|
|
|
|
|
|
|
|
||||||
(Unaudited) |
Nine Months Ended |
||||||||||||
(Amounts in Thousands, except Per Share Data) |
March 31, 2023 |
|
March 31, 2022 |
||||||||||
Net Sales |
$ |
1,327,288 |
|
|
100.0 |
% |
|
$ |
976,038 |
|
|
100.0 |
% |
Cost of Sales |
|
1,220,804 |
|
|
92.0 |
% |
|
|
905,657 |
|
|
92.8 |
% |
Gross Profit |
|
106,484 |
|
|
8.0 |
% |
|
|
70,381 |
|
|
7.2 |
% |
Selling and Administrative Expenses |
|
50,204 |
|
|
3.8 |
% |
|
|
39,794 |
|
|
4.0 |
% |
Other General Expense (Income) |
|
— |
|
|
— |
% |
|
|
(1,384 |
) |
|
(0.1 |
)% |
Operating Income |
|
56,280 |
|
|
4.2 |
% |
|
|
31,971 |
|
|
3.3 |
% |
Other Income (Expense), net |
|
(8,043 |
) |
|
(0.6 |
)% |
|
|
(3,561 |
) |
|
(0.4 |
)% |
Income Before Taxes on Income |
|
48,237 |
|
|
3.6 |
% |
|
|
28,410 |
|
|
2.9 |
% |
Provision for Income Taxes |
|
11,608 |
|
|
0.8 |
% |
|
|
7,095 |
|
|
0.7 |
% |
Net Income |
$ |
36,629 |
|
|
2.8 |
% |
|
$ |
21,315 |
|
|
2.2 |
% |
|
|
|
|
|
|
|
|
||||||
Earnings Per Share of Common Stock: |
|
|
|
|
|
|
|
||||||
Basic |
$ |
1.47 |
|
|
|
|
$ |
0.84 |
|
|
|
||
Diluted |
$ |
1.46 |
|
|
|
|
$ |
0.84 |
|
|
|
||
|
|
|
|
|
|
|
|
||||||
Average Number of Shares Outstanding: |
|
|
|
|
|
|
|
||||||
Basic |
|
24,868 |
|
|
|
|
|
25,192 |
|
|
|
||
Diluted |
|
25,031 |
|
|
|
|
|
25,291 |
|
|
|
||
Condensed Consolidated Statements of Cash Flows |
Nine Months Ended |
||||||
(Unaudited) |
March 31, |
||||||
(Amounts in Thousands) |
2023 |
|
2022 |
||||
Net Cash Flow used for Operating Activities |
$ |
(57,885 |
) |
|
$ |
(84,665 |
) |
Net Cash Flow used for Investing Activities |
|
(66,497 |
) |
|
|
(50,023 |
) |
Net Cash Flow provided by Financing Activities |
|
107,148 |
|
|
|
64,856 |
|
Effect of Exchange Rate Change on Cash and Cash Equivalents |
|
(294 |
) |
|
|
(1,007 |
) |
Net Decrease in Cash, Cash Equivalents, and Restricted Cash |
|
(17,528 |
) |
|
|
(70,839 |
) |
Cash, Cash Equivalents, and Restricted Cash at Beginning of Period |
|
49,851 |
|
|
|
106,442 |
|
Cash, Cash Equivalents, and Restricted Cash at End of Period |
$ |
32,323 |
|
|
$ |
35,603 |
|
|
(Unaudited) |
|
|
||
Condensed Consolidated Balance Sheets |
March 31,
|
|
June 30,
|
||
(Amounts in Thousands) |
|||||
ASSETS |
|
|
|
||
Cash and cash equivalents |
$ |
30,445 |
|
$ |
49,851 |
Receivables, net |
|
299,329 |
|
|
222,857 |
Contract assets |
|
75,690 |
|
|
64,080 |
Inventories |
|
488,170 |
|
|
395,630 |
Prepaid expenses and other current assets |
|
54,053 |
|
|
28,665 |
Property and Equipment, net |
|
258,058 |
|
|
206,835 |
Goodwill |
|
12,011 |
|
|
12,011 |
Other Intangible Assets, net |
|
13,210 |
|
|
14,707 |
Other Assets |
|
37,975 |
|
|
41,131 |
Total Assets |
$ |
1,268,941 |
|
$ |
1,035,767 |
|
|
|
|
||
LIABILITIES AND SHARE OWNERS’ EQUITY |
|
|
|
||
Current portion of borrowings under credit facilities |
$ |
54,420 |
|
$ |
35,580 |
Accounts payable |
|
361,547 |
|
|
308,617 |
Accrued expenses |
|
89,961 |
|
|
64,545 |
Long-term debt under credit facilities, less current portion |
|
235,000 |
|
|
145,000 |
Long-term income taxes payable |
|
5,859 |
|
|
7,812 |
Other long-term liabilities |
|
18,968 |
|
|
20,242 |
Share Owners’ Equity |
|
503,186 |
|
|
453,971 |
Total Liabilities and Share Owners’ Equity |
$ |
1,268,941 |
|
$ |
1,035,767 |
Reconciliation of Non-GAAP Financial Measures |
||||||||||||||
(Unaudited) |
||||||||||||||
(Amounts in Thousands, except Per Share Data) |
||||||||||||||
|
|
|
|
|
|
|
|
|||||||
|
Three Months Ended |
|
Nine Months Ended |
|||||||||||
|
March 31, |
|
March 31, |
|||||||||||
|
2023 |
|
2022 |
|
2023 |
|
2022 |
|||||||
Operating Income, as reported |
$ |
25,220 |
|
$ |
20,277 |
|
|
$ |
56,280 |
|
|
$ |
31,971 |
|
SERP |
|
353 |
|
|
(719 |
) |
|
|
458 |
|
|
|
(404 |
) |
Legal Settlements (Recovery) |
|
— |
|
|
— |
|
|
|
— |
|
|
|
(1,384 |
) |
Adjusted Operating Income |
$ |
25,573 |
|
$ |
19,558 |
|
|
$ |
56,738 |
|
|
$ |
30,183 |
|
|
|
|
|
|
|
|
|
|||||||
Net Income, as reported |
$ |
16,400 |
|
$ |
13,638 |
|
|
$ |
36,629 |
|
|
$ |
21,315 |
|
Adjustments After Measurement Period on GES Acquisition |
|
— |
|
|
— |
|
|
|
279 |
|
|
|
— |
|
Legal Settlements (Recovery), After-Tax |
|
— |
|
|
— |
|
|
|
— |
|
|
|
(1,050 |
) |
Adjusted Net Income |
$ |
16,400 |
|
$ |
13,638 |
|
|
$ |
36,908 |
|
|
$ |
20,265 |
|
|
|
|
|
|
|
|
|
|||||||
Diluted Earnings per Share, as reported |
$ |
0.65 |
|
$ |
0.54 |
|
|
$ |
1.46 |
|
|
$ |
0.84 |
|
Adjustments After Measurement Period on GES Acquisition |
|
— |
|
|
— |
|
|
|
0.01 |
|
|
|
— |
|
Legal Settlements (Recovery) |
|
— |
|
|
— |
|
|
|
— |
|
|
|
(0.04 |
) |
Adjusted Diluted Earnings per Share |
$ |
0.65 |
|
$ |
0.54 |
|
|
$ |
1.47 |
|
|
$ |
0.80 |
|
|
|
|
|
|
|
|
|
|||||||
|
|
|
|
|
Twelve Months Ended |
|||||||||
|
|
|
|
|
March 31, |
|||||||||
|
|
|
|
|
2023 |
|
2022 |
|||||||
Operating Income |
|
|
|
|
$ |
76,858 |
|
|
$ |
49,050 |
|
|||
SERP |
|
|
|
|
|
(701 |
) |
|
|
144 |
|
|||
Legal Recovery |
|
|
|
|
|
— |
|
|
|
(1,039 |
) |
|||
Adjusted Operating Income (non-GAAP) |
|
|
|
|
$ |
76,157 |
|
|
$ |
48,155 |
|
|||
Tax Effect |
|
|
|
|
|
20,375 |
|
|
|
10,774 |
|
|||
After-tax Adjusted Operating Income |
|
|
|
|
$ |
55,782 |
|
|
$ |
37,381 |
|
|||
Average Invested Capital (1) |
|
|
|
|
$ |
659,911 |
|
|
$ |
453,479 |
|
|||
ROIC |
|
|
|
|
|
8.5 |
% |
|
|
8.2 |
% |
|||
(1) |
Average invested capital is computed using Share Owners’ equity plus current and non-current debt less cash and cash equivalents averaged for the last five quarters. |
Contacts
Andrew D. Regrut
Vice President, Investor Relations
812.827.4151
Investor.Relations@kimballelectronics.com