Global Business Spend Indicator, New Survey by American Express, Shows U.S. Businesses Have Bullish Outlook on B2B Spending
Global Business Spend Indicator, New Survey by American Express, Shows U.S. Businesses Have Bullish Outlook on B2B Spending
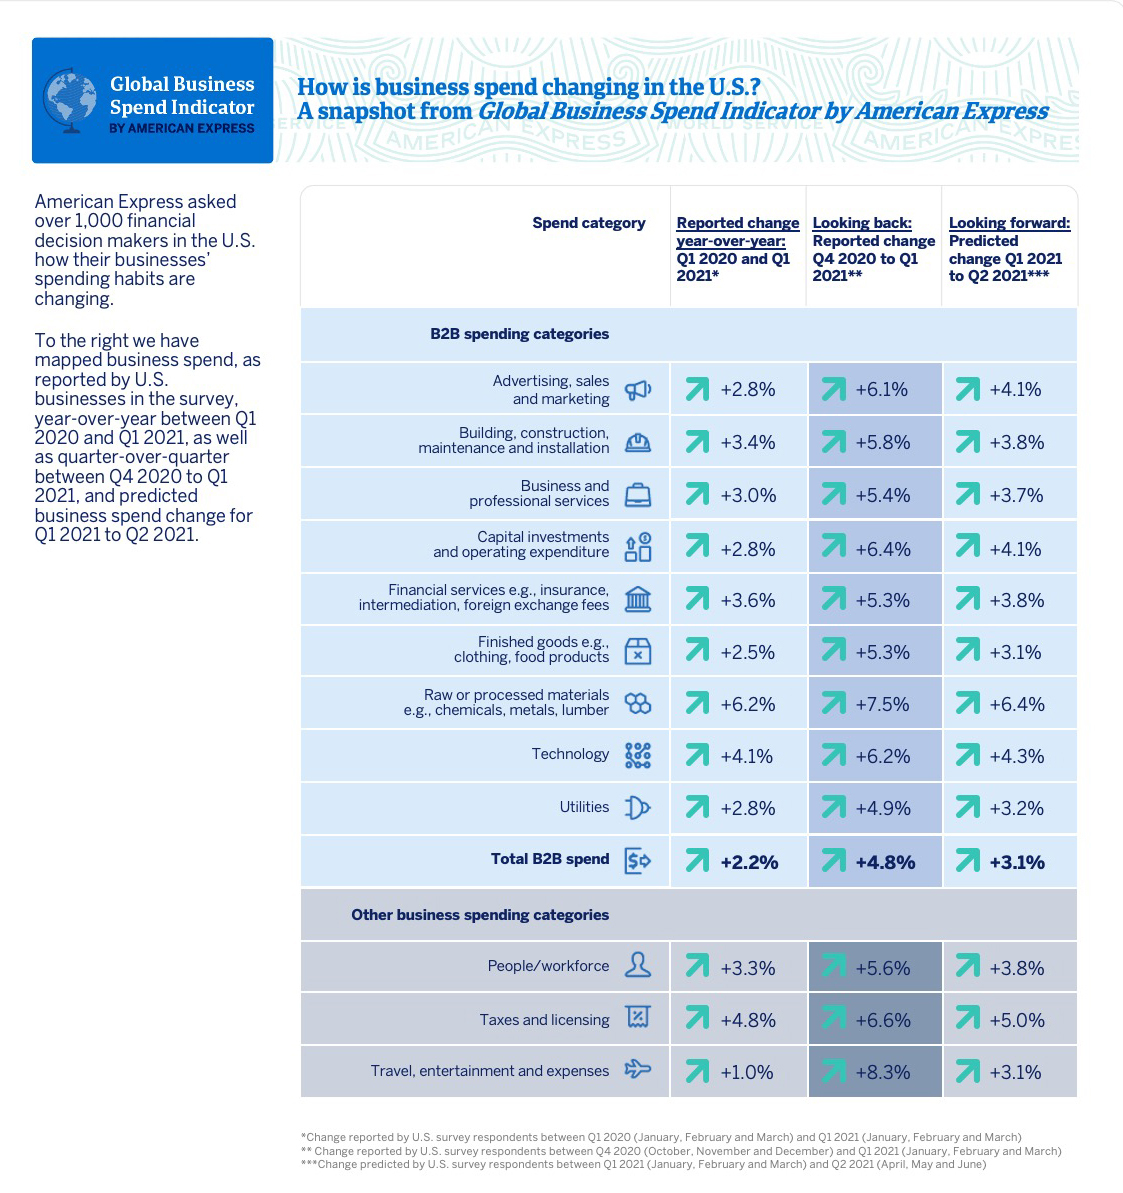
- Survey indicates that U.S. spending is on the rise across nine key business-to-business (B2B) categories.
- U.S. survey respondents cited that raw or processed materials, such as lumber, metals, and chemicals, are outpacing all other B2B spending categories.
- Automation is anticipated to be the fastest-growing area in technology spending, with nearly half of U.S. survey respondents planning to automate or further automate their B2B payments over the next year1.
- Flexibility is key for the U.S. businesses surveyed, which are adapting their supply chains due to pandemic challenges.
NEW YORK--(BUSINESS WIRE)--American Express (NYSE:AXP) today launched the Global Business Spend Indicator (GBSI), a new survey of global businesses conducted with the Centre for Business and Economic Research (CEBR)². The survey reveals U.S. businesses are the most bullish and optimistic when it comes to B2B spending among the six countries covered in the survey, with 76% of U.S. businesses expressing optimism about their prospects over the next 12 months. Respondents predicted that B2B spending in the U.S. will be an average of 3.4% higher in the second quarter compared to the same period last year. Applying that projection from the survey respondents to broader U.S. macroeconomic data would equate to an estimated $140 billion in additional B2B spending from U.S. businesses³.
“B2B spending is an important bellwether for the overall health of the economy, and the GBSI study shows U.S. businesses are investing and spending more, whether to adopt to the new ways of operating during the pandemic, or to digitize and streamline their operations,” said Dean Henry, EVP, Global Commercial Services at American Express. “It also reveals that some of the trends that have emerged or accelerated during the pandemic, such as payments automation and new approaches to managing the supply chain, are likely here to stay.”
CEBR estimates that the value of B2B expenditures each year amounts to nearly half (48%) of gross output (the total value of sales or receipts) in the U.S. economy. This means that for each dollar spent in the U.S. economy, approximately 48 cents are B2B transactions.
The GBSI is designed to explore the importance of business spending in both the global and local economies based on a survey of more than 3,600 businesses of all sizes and across industries in the UK, Australia, Canada, Japan, Mexico, and the U.S. For this report, B2B spend is classified as goods and services that a business purchases from another business to keep their business running. The survey looked at nine B2B spending categories, and three additional categories of taxes, people / workforce, and travel, entertainment and expenses, for a robust look at the dynamics and impact of overall business spending.
Raw or Processed Materials Top B2B Spend Categories
U.S. businesses surveyed reported that they have increased their overall B2B spending across all the core categories since the start of the year. The highest growth rates were in spending on raw or processed materials such as lumber, metals, and chemicals, which rose by an average of 6.2% between Q1 2020 and Q1 2021, according to survey respondents. This would equate to an estimated $37 billion in additional spend when applied to U.S. macroeconomic data, most likely due to rising prices of raw materials after the onset of the pandemic.
This trend is expected to continue, with the U.S. businesses surveyed anticipating another 6.4% rise in spending in this category from Q2 2021 over the prior quarter.
U.S. Businesses Lead in Payments Automation, with Plans to Continue Investing in the Year Ahead
Within the technology spending category, automation is the fastest anticipated growth area among the U.S. businesses surveyed. While many businesses have already been digitizing their B2B payments over the past few years, the pandemic helped accelerate this trend more broadly.
The GBSI found that, of the six surveyed countries, U.S. businesses have the highest level of automation across most business functions, including with purchasing / procurement, payroll, paying suppliers, supplier analysis, and syncing payments to the existing ledger. In fact, nearly half of U.S. businesses surveyed said they are mostly or fully automating the making (48%) and receiving (51%) of payments from business customers. In addition, there is more opportunity ahead as nearly half (46%) plan to automate or further automate each of these functions over the next 12 months.
With more automation, U.S. businesses may vastly reduce their reliance on manual payment methods – like writing and sending physical checks – which are still prevalent, with 33% of U.S. business spend currently using physical payment methods, according to the businesses surveyed.
On the whole, technology spending by U.S. businesses surveyed rose by an average of 4.1% between Q1 2020 and Q1 2021, equating to an estimated $25 billion in additional spend when applied to U.S. macroeconomic data, likely driven by the rapid digitization of businesses such as e-commerce capabilities or website enhancements. Nearly a quarter (22%) of U.S. businesses surveyed list increasing their online presence among their top three goals and 39% expect to expand their use of virtual cards over the next 12 months.
U.S. Businesses Prioritize Streamlined and Flexible Supply Chain Relationships
For many businesses, the experiences during the pandemic highlighted ways to streamline and seek more flexible ways to manage their supply chains and operating practices.
Over the last 12 months, 23% of U.S. businesses surveyed took steps to simplify their network of suppliers, 23% reduced or avoided long-term commitments to purchase from specific suppliers, and 22% chose suppliers with more flexible payment terms.
Looking Ahead
Over the next 12 months, U.S. businesses in the survey cite increasing profitability (34%), securing new business or bringing on new customers (32%), and remaining competitive (31%) as being among their three most important goals.
GLOBAL BUSINESS SPEND INDICATOR BY AMERICAN EXPRESS METHODOLOGY
The Global Business Spend Indicator by American Express leverages survey data from more than 3,600 companies across Australia, Canada, Japan, Mexico, the UK and the U.S. Together, these countries account for around two-fifths of global economic output, making the GBSI a key bellwether of conditions in the business-to-business (B2B) spending landscape. In each country, a similar number of sole traders, micro businesses (with 1-9 employees), small businesses (with 10-49 employees), medium-sized businesses (with 50-249 employees), and large businesses (with 250+ employees) have been surveyed, providing a holistic insight into the diversity of perspectives and experiences that exist within the business population.
B2B spend categories include: raw or processed materials; capital investments and operating expenditure; technology; building, construction, maintenance and installation; finished goods; advertising, sales and marketing; business and professional services; utilities; financial services. Broader business spend categories include: taxes and licensing; travel, entertainment and expenses; people / workforce.
The survey underpinning this edition of the GBSI was conducted by Opinium research between 18th March and 12th April 2021. The sample is comprised of senior decision makers with responsibility over at least three categories of expenditure. In this report, Q1 refers to the first three months of the calendar year (January, February, and March), Q2 refers to April, May and June and Q4 refers to October, November and December. The sample comprised 1,044 respondents in the U.S., 528 in Australia, 515 in Canada, 516 in Japan, 544 in Mexico and 537 in the UK. At a 95% confidence level, this equates to a 3% margin of error for the U.S. sample and a 4% margin of error for Australia, Canada, Japan, Mexico and the UK.
Estimates of the $ change in spending across the six countries are computed based on the proportion of total spend that each category accounts for among businesses in the survey together with the average change in spend reported. Baseline levels of business spending are estimated using the latest available national accounts data on intermediate consumption, gross fixed capital formation and employee compensation, with figures for 2020 computed based on the assumption that changes in business spending in each country are proportional to GDP.
ABOUT AMERICAN EXPRESS
American Express is a globally integrated payments company, providing customers with access to products, insights and experiences that enrich lives and build business success. Learn more at americanexpress.com and connect with us on facebook.com/americanexpress, instagram.com/americanexpress, linkedin.com/company/american-express, twitter.com/americanexpress, and youtube.com/americanexpress. Key links to products, services and corporate responsibility information: charge and credit cards, business credit cards, travel services, gift cards, prepaid cards, merchant services, Accertify, Kabbage, corporate card, business travel, and corporate responsibility.
ABOUT THE CENTRE FOR ECONOMICS AND BUSINESS RESEARCH
The Centre for Economics and Business Research is an independent consultancy with a reputation for sound business advice based on thorough and insightful research. Since 1992, Cebr has been at the forefront of business and public interest research. They provide analysis, forecasts and strategic advice to major UK and multinational companies, financial institutions, government departments and agencies and trade bodies. For further information about Cebr please visit www.cebr.com.
__________________________
1 Percentages equate to the share of U.S. businesses that mostly or fully automate the process of making payments to suppliers or receiving payments from business customers.
2 CEBR is a leading economics consultancy specializing in economic forecasting and analysis.
3 Estimates of the $ change in spending across the six countries are computed based on the proportion of total spend that each category accounts for among businesses in the survey together with the average change in spend reported. Baseline levels of business spending are estimated using the latest available national accounts data on intermediate consumption, gross fixed capital formation and employee compensation, with figures for 2020 computed based on the assumption that changes in business spending in each country are proportional to GDP. The $ changes presented specifically for the U.S. market are based on the responses from U.S. businesses in the sample only.
Contacts
AMERICAN EXPRESS
Melissa Filipek
melissa.j.filipek@aexp.com
Felicia Macdonald
felicia.m.macdonald@aexp.com