For the first time, Argonne researchers reveal how COVID-19 has transformed communities
For the first time, Argonne researchers reveal how COVID-19 has transformed communities
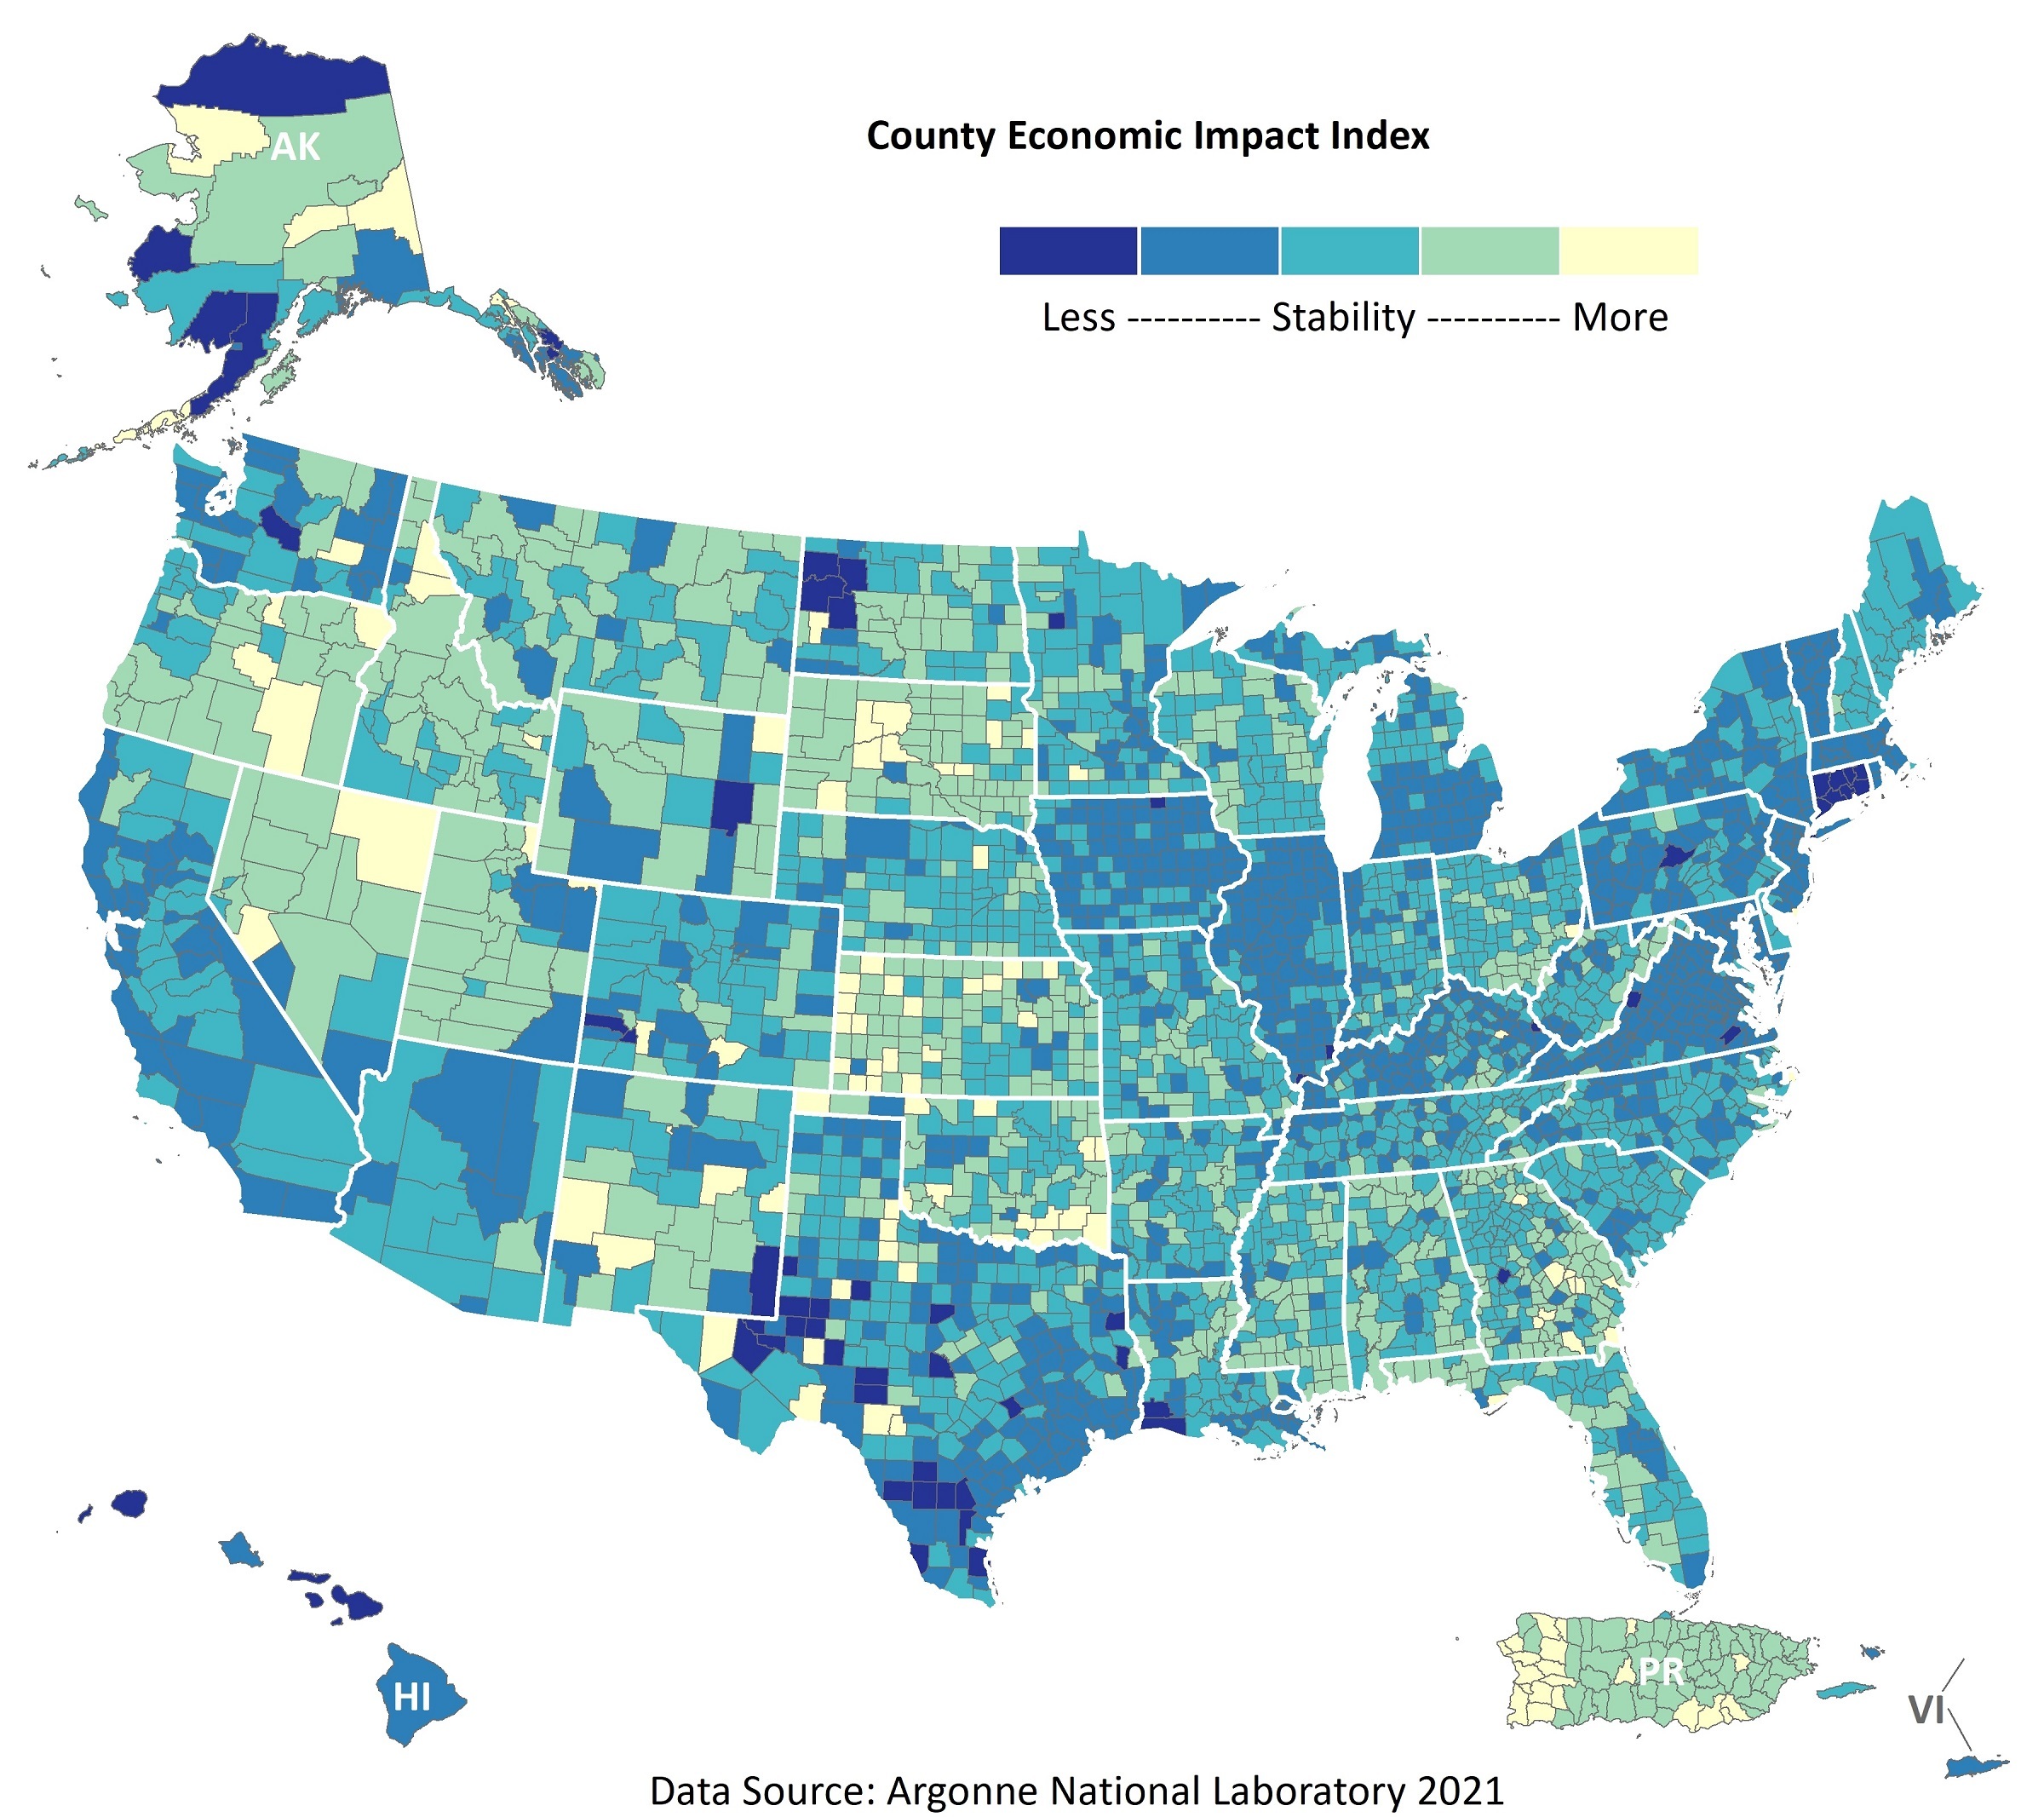
LEMONT, Ill.--(BUSINESS WIRE)--The public now has access to a series of data and analysis resources designed to support and inform long-term COVID-19 recovery efforts across the United States. On May 12th, the U.S. Department of Energy’s Argonne National Laboratory released interactive maps and data that show the socio-economic effects of the novel coronavirus outbreak.
Argonne developed these resources to help federal agencies understand where impacts are most acute (down to the county level), and which demographic groups and facets of the economy—employment, housing stability, public sector services—may require recovery support. This is helping to guide federal recovery efforts, from informing federal engagement efforts with affected communities to helping target delivery of aid.
Researchers at Argonne sought advice and data from federal agencies that would likely be using these data and analyses—the Department of Commerce, Department of the Treasury, the Department of Interior Office of Insular Affairs, and more than 20 others.
Argonne built a web-based portal, gathered more than 100 data sources, and developed an initial set of analyses in less than a month. “We tapped economists, infrastructure analysts, all the smartest people we could find to do comparisons between pre- and post-pandemic data sets,” says portal project leader Carmella Burdi, a senior geographic information systems analyst. “That allows us to put a finer point on things than other agencies.”
One interactive map lets you to zoom in on any of the more than 3,000 U.S. counties to instantly generate a shareable report on how, month by month since January 2020, the pandemic has impacted gross domestic product in that particular area. Another map displays the pandemic’s impact on state and local government revenues—important because those bodies often are required to match funds in order to receive federal aid. A third map shows counties where households are at greater risk of foreclosure or eviction as a result of COVID-19.
“The data we’re collecting,” says Iain Hyde, deputy director of the DIS division’s National Preparedness Analytics Center, “is trying to give people perspective on the starting point for the recovery, and give them the information they need to develop a road map moving forward as to how we rebuild the economy, create jobs, help people stay in their housing—and make our communities less susceptible to the next pandemic.”
Contacts
Christopher J. Kramer
Head of Media Relations
Argonne National Laboratory
Office: 630.252.5580
media@anl.gov