Certainty in Outlook: CoreLogic’s Home Price Index Forecasts Provide Accurate Results, According to Latest Validation Report
Certainty in Outlook: CoreLogic’s Home Price Index Forecasts Provide Accurate Results, According to Latest Validation Report
Analysis reveals 12-month national forecast is within 2.8% of actual HPI increase
IRVINE, Calif.--(BUSINESS WIRE)--CoreLogic® (NYSE: CLGX), a leading global property information, analytics and data-enabled solutions provider, today released its latest CoreLogic® HPI Forecast Validation Report that compares its 12-month CoreLogic Home Price Index (HPI) Forecasts™ to the actual CoreLogic HPI™. The report compares the changes in national and key metro-level forecasts made in November 2019 to the actual CoreLogic HPI, which includes data through November 2020.
The CoreLogic HPI Forecasts are a projection of home prices using the CoreLogic HPI and other economic variables. National values are derived from state-level forecasts by weighing indices according to the number of housing units for each state. Published twice yearly, the CoreLogic HPI Forecast Validation Report is designed to provide transparency into CoreLogic forecasting abilities.
The most recent report shows:
- Over a 12-month period, seven of the top 50 most populous metropolitan areas had a forecast that was within one percentage point of the actual home-price change.
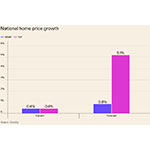
- The National Index Forecast had a 5.4% change prediction, and the actual index value was 8.2% with a difference of 2.8%.
- The forecast was greatly impacted by unexpected demand increases due to lower interest rates, which was spurred on as a result of the coronavirus (COVID-19) pandemic.
- Cambridge-Newton-Framingham, Massachusetts; West Palm Beach-Boca Raton-Delray Beach, Florida; and Los Angeles-Long Beach-Glendale, California, had the most accurate forecasts.
- Home price growth in Austin-Round Rock, Texas, was the most significantly underestimated metro. There is some anecdotal evidence that many high-tech companies are relocating from high-cost areas like San Francisco and New York to alternative locations such as Austin, leading to price declines in the former two cities and an increase in the latter.
- All of the major metros included on CoreLogic’s top 10 most-accurate list are new to the CoreLogic ranking, except for the Orlando-Kissimmee-Sanford, Florida, area, which was on the most accurate list in the November 2020 report.
- The Bridgeport-Stamford-Norwalk, Connecticut, metro continues to be the most undervalued mid-to-large sized market; Fort Walton Beach, Florida, is the most overvalued.
“The pandemic has impacted CoreLogic’s HPI Forecasts over the last 12 months, creating unforeseeable and ongoing market volatility,” said Ann Regan, executive, product management for CoreLogic. “Even with these headwinds, our forecasts were highly accurate within the November 2019 to July 2020 timeframe and continue to demonstrate why CoreLogic is the gold standard in forecasting market price trends.”
Top 10 Most Accurately Forecasted Metros
Listed in order of accuracy
Ranking |
Market |
Population |
HPI
|
Forecasted
|
Difference |
|||||
1 |
Cambridge-Newton-Framingham, MA |
2,400,733 |
|
7.1% |
|
7.4% |
|
0.3% |
||
2 |
West Palm Beach-Boca Raton-Delray Beach, FL |
1,496,770 |
|
7.3% |
|
6.9% |
|
-0.4% |
||
3 |
Los Angeles-Long Beach-Glendale, CA |
10,039,107 |
|
7.2% |
|
6.7% |
|
-0.5% |
||
4 |
Miami-Miami Beach-Kendall, FL |
2,716,940 |
|
5.8% |
|
6.3% |
|
0.5% |
||
5 |
Chicago-Naperville-Arlington Heights, IL |
7,122,725 |
|
6.4% |
|
7.0% |
|
0.5% |
||
6 |
Boston, MA |
2,031,884 |
|
5.0% |
|
5.8% |
|
0.8% |
||
7 |
Riverside-San Bernardino-Ontario, CA |
4,650,631 |
|
10.9% |
|
11.8% |
|
0.8% |
||
8 |
Pittsburgh, PA |
2,317,600 |
|
4.4% |
|
5.5% |
|
1.1% |
||
9 |
Orlando-Kissimmee-Sanford, FL |
2,608,147 |
|
6.8% |
|
5.5% |
|
-1.3% |
||
10 |
Warren-Troy-Farmington Hills, MI |
2,570,286 |
|
7.1% |
|
5.8% |
|
-1.4% |
About CoreLogic
CoreLogic (NYSE: CLGX), the leading provider of property insights and solutions, promotes a healthy housing market and thriving communities. Through its enhanced property data solutions, services and technologies, CoreLogic enables real estate professionals, financial institutions, insurance carriers, government agencies and other housing market participants to help millions of people find, buy and protect their homes. For more information, please visit www.corelogic.com.
CORELOGIC the CoreLogic logo, CORELOGIC HPI and CORELOGIC HPI FORECASTS are trademarks of CoreLogic, Inc. and/or its subsidiaries. All other trademarks are the property of their respective owners.
Contacts
Valerie Sheets
949-838-5428
newsmedia@corelogic.com