Strong and Resilient: CoreLogic Reports July U.S. Home Price Appreciation Reached its Highest Level Since 2018
Strong and Resilient: CoreLogic Reports July U.S. Home Price Appreciation Reached its Highest Level Since 2018
- CoreLogic U.S. Home Price Index jumps to 5.5% year-over-year increase in July
- HPI Forecast predicts home price growth will slow through 2021 but remain positive

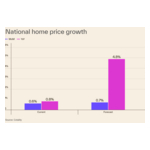
IRVINE, Calif.--(BUSINESS WIRE)--CoreLogic® (NYSE: CLGX), a leading global property information, analytics and data-enabled solutions provider, today released the CoreLogic Home Price Index (HPI™) and HPI Forecast™ for July 2020. Nationally, home prices increased 5.5% in July 2020, compared with July 2019, and were up 1.2% compared to last month, when home prices increased 4.3%.
In July, annual home price growth accelerated to its fastest rate in nearly two years. The one-two punch of strong purchase demand — bolstered by falling mortgage rates, which dipped below 3% for the first time ever in July — and further constriction of for-sale inventory has driven upward pressure on home price appreciation. The national HPI Forecast shows annual home price growth slowing through July 2021, reflecting the anticipated elevated unemployment rates during the next year. This could lead to an increase of distressed-sale inventory as continued financial pressures leave some homeowners unable to make mortgage payments, especially as forbearance periods come to a close.
“Lower-priced homes are sought after and have had faster annual price growth than luxury homes,” said Dr. Frank Nothaft, chief economist at CoreLogic. “First-time buyers and investors are actively seeking lower-priced homes, and that segment of the housing market is in particularly short supply.”
“On an aggregated level, the housing economy remains rock solid despite the shock and awe of the pandemic. A long period of record-low mortgage rates has opened the flood gates for a refinancing boom that is likely to last for several years," said Frank Martell, president and CEO of CoreLogic. "In addition, after a momentary COVID-19-induced blip, purchase demand has picked up, driven by low rates and enthusiastic millennial and investor buyers. Spurred on by strong demand and record-low mortgage rates, we expect to see more home building in 2021 and beyond, which should help support a healthy housing market for years to come.”
Despite the rapid acceleration of national home price growth, local markets continue to fluctuate. In particular, homebuying activity is becoming more pronounced in traditionally affordable suburban and rural areas that allow for more space as schools and work remain online. For example, home prices in Nassau and Suffolk counties on Long Island experienced an annual gain of 4.3% in July, as residents continue to migrate away from more densely populated areas like the New York-Jersey City-White Plains metro, which recorded only a 0.4% increase.
Looking forward, the HPI Forecast also reveals the disparity of home prices across metros. In markets like Las Vegas, where the local tourism economy and job market continue to struggle from the effects of the pandemic, home prices are expected to decline 7.8% by July 2021. Meanwhile, in San Diego, home prices are forecasted to increase 5.8% over the next 12 months as low inventory continues to push prices up.
The CoreLogic Market Risk Indicator (MRI), a monthly update of the overall health of housing markets across the country, predicts that metro areas with an elevated resurgence of COVID-19 cases — like Prescott, Arizona and Miami, Florida — are at the greatest risk (above 70%) of a decline in home prices over the next 12 months. Other metro areas with a high risk of price declines include Lake Charles, Louisiana; Huntington, West Virginia and Las Vegas.
The next CoreLogic HPI press release, featuring August 2020 data, will be issued on October 6 at 8:00 a.m. ET.
Methodology
The CoreLogic HPI™ is built on industry-leading public record, servicing and securities real-estate databases and incorporates more than 40 years of repeat-sales transactions for analyzing home price trends. Generally released on the first Tuesday of each month with an average five-week lag, the CoreLogic HPI is designed to provide an early indication of home price trends by market segment and for the “Single-Family Combined” tier, representing the most comprehensive set of properties, including all sales for single-family attached and single-family detached properties. The indices are fully revised with each release and employ techniques to signal turning points sooner. The CoreLogic HPI provides measures for multiple market segments, referred to as tiers, based on property type, price, time between sales, loan type (conforming vs. non-conforming) and distressed sales. Broad national coverage is available from the national level down to ZIP Code, including non-disclosure states.
CoreLogic HPI Forecasts™ are based on a two-stage, error-correction econometric model that combines the equilibrium home price—as a function of real disposable income per capita—with short-run fluctuations caused by market momentum, mean-reversion, and exogenous economic shocks like changes in the unemployment rate. With a 30-year forecast horizon, CoreLogic HPI Forecasts project CoreLogic HPI levels for two tiers — “Single-Family Combined” (both attached and detached) and “Single-Family Combined Excluding Distressed Sales.” As a companion to the CoreLogic HPI Forecasts, Stress-Testing Scenarios align with Comprehensive Capital Analysis and Review (CCAR) national scenarios to project five years of home prices under baseline, adverse and severely adverse scenarios at state, metropolitan areas and ZIP Code levels. The forecast accuracy represents a 95% statistical confidence interval with a +/- 2% margin of error for the index.
About Market Risk Indicator
Market Risk Indicators are a subscription-based analytics solution that provide monthly updates on the overall “health” of housing markets across the country. CoreLogic data scientists combine world-class analytics with detailed economic and housing data to help determine the likelihood of a housing bubble burst in 392 major metros and all 50 states. Market Risk Indicators is a multi-phase regression model that provides a probability score (from 1 to 100) on the likelihood of two scenarios per metro: a >10% price reduction and a ≤ 10% price reduction. The higher the score, the higher the risk of a price reduction.
About the Market Condition Indicators
As part of the CoreLogic HPI and HPI Forecasts offerings, Market Condition Indicators are available for all metropolitan areas and identify individual markets as “overvalued,” “at value,” or “undervalued.” These indicators are derived from the long-term fundamental values, which are a function of real disposable income per capita. Markets are labeled as overvalued if the current home price indexes exceed their long-term values by greater than 10%, and undervalued where the long-term values exceed the index levels by greater than 10%.
Source: CoreLogic
The data provided are for use only by the primary recipient or the primary recipient's publication or broadcast. This data may not be resold, republished or licensed to any other source, including publications and sources owned by the primary recipient’s parent company without prior written permission from CoreLogic. Any CoreLogic data used for publication or broadcast, in whole or in part, must be sourced as coming from CoreLogic, a data and analytics company. For use with broadcast or web content, the citation must directly accompany first reference of the data. If the data are illustrated with maps, charts, graphs or other visual elements, the CoreLogic logo must be included on screen or website. For questions, analysis or interpretation of the data, contact Valerie Sheets at newsmedia@corelogic.com. Data provided may not be modified without the prior written permission of CoreLogic. Do not use the data in any unlawful manner. The data are compiled from public records, contributory databases and proprietary analytics, and its accuracy is dependent upon these sources.
About CoreLogic
CoreLogic (NYSE: CLGX), the leading provider of property insights and solutions, promotes a healthy housing market and thriving communities. Through its enhanced property data solutions, services and technologies, CoreLogic enables real estate professionals, financial institutions, insurance carriers, government agencies and other housing market participants to help millions of people find, buy and protect their homes. For more information, please visit www.corelogic.com.
CORELOGIC, the CoreLogic logo, CoreLogic HPI and CoreLogic HPI Forecast are trademarks of CoreLogic, Inc. and/or its subsidiaries. All other trademarks are the property of their respective owners.
Contacts
Valerie Sheets
newsmedia@corelogic.com