Newsroom
Sorted by: Latest
-
Rosen Law Firm Urges Insulet Corporation (NASDAQ: PODD) Stockholders with Large Losses to Contact the Firm for Information About Their Rights
NEW YORK--(BUSINESS WIRE)--Rosen Law Firm, a global investor rights law firm, announces a class action lawsuit on behalf of purchasers and acquirers of Insulet Corporation (NASDAQ: PODD) securities between February 21, 2025 and May 26, 2026, inclusive (the “Class Period”). Insulet develops, manufactures, and sells insulin delivery systems.For more information, submit a form, email attorney Phillip Kim, or give us a call at 866-767-3653.The Allegations: Rosen Law Firm is Investigating the Allegat...
-
ComEd Restores Power to Over 240,000 Customers as Crews Push Through Holiday Weekend to Finish Restoration
CHICAGO--(BUSINESS WIRE)--ComEd crews are entering the final stretch of restoration efforts after four rounds of severe weather swept across northern Illinois beginning Thursday night, with additional storms rolling through Friday and a fourth system striking on Saturday. In total, nearly 297,000 customers were impacted across the service territory. As of 11:30 a.m. Sunday, ComEd had restored power to more than 283,000 customers, with roughly 14,000 remaining without service. About 95 percent o...
-
Pat Mercuri’s Mortgage Marketing Conference Presentation Highlights the Growing Demand for Data-Driven Direct Mail Strategies
IRVINE, Calif.--(BUSINESS WIRE)--Managed Direct Response announced the successful completion of a recent mortgage industry conference where Founder and President Pat Mercuri shared proven direct mail marketing strategies designed to help mortgage companies increase response rates, improve lead quality, and drive higher conversion rates. Mortgage professionals from across the industry attended the presentation to learn how today’s lenders are combining advanced data, highly targeted mailing stra...

-
Chinesischer Rechtsexperte fordert stärkere Rechtsstaatlichkeit zur Förderung der ESG-Zusammenarbeit zwischen China und Europa
MAINZ, Deutschland--(BUSINESS WIRE)--Ein stärkerer rechtlicher Rahmen und größere Rechtssicherheit seien für den Ausbau der Zusammenarbeit zwischen China und Europa in den Bereichen Umwelt, Soziales und Unternehmensführung (ESG) unerlässlich, da Unternehmen mit immer komplexeren grenzüberschreitenden Compliance-Anforderungen konfrontiert seien, erklärte ein chinesischer Rechtsexperte. Bei seiner Rede auf der dritten chinesisch-europäischen Konferenz zu ESG-Best-Practices für Unternehmen in Main...
-
Chinese Legal Expert Calls for Stronger Rule of Law to Advance China-Europe ESG Cooperation
MAINZ, Germany--(BUSINESS WIRE)--A stronger legal framework and greater regulatory certainty will be essential to expanding ESG cooperation between China and Europe....

-
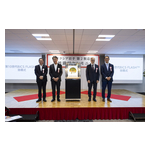
CG Semi Commences Commercial Production at Its G1 OSAT Facility in Sanand, Gujarat
SANAND, GUJARAT, India--(BUSINESS WIRE)--CG Semi commences commercial production at its G1 OSAT facility in Sanand, Gujarat, A key milestone in India’s semiconductor manufacturing journey....
-
ComEd Continues Power Restoration Following Two Powerful Storms
CHICAGO--(BUSINESS WIRE)--ComEd crews continue to make progress restoring power to customers after a triple punch of severe storms swept across northern Illinois on Thursday night and Friday afternoon. The most severely impacted areas were the north and south regions of ComEd’s territory including Tinley Park, Burbank, Homewood and some southern wards in the City among the hardest hit areas. The storms brought heavy rain, frequent lightning and wind gusts over 50 miles per hour, causing extensi...
-
Operation Rooftop Returns for a Third Year: TAMKO and Kansas City Chiefs Honor America’s Heroes on Nation’s 250th Birthday
JOPLIN, Mo.--(BUSINESS WIRE)--As America celebrates 250 years of independence, TAMKO Building Products, Proud Partner of the Kansas City Chiefs, announces the return of Operation Rooftop for its third consecutive year. The roof giveaway sweepstakes honors current and former members of the U.S. military by providing one American hero each year with a new roof. What began as a shared commitment between TAMKO and the Kansas City Chiefs has grown into an annual patriotic tradition focused on recogn...

-
R|Elan™ Circular Design Challenge Celebrates Its 8th Season with a Landmark Global Edition Under the India–France Year of Innovation 2026
LONDON--(BUSINESS WIRE)--Celebrating its eighth season, the R|Elan™ Circular Design Challenge returns as a flagship partnership under the India–France Year of Innovation 2026....
-
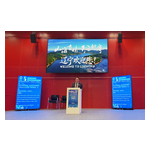
Kioxia與Sandisk宣佈開始在北上廠區Fab2量產第10代3D快閃記憶體
東京與加州米爾皮塔斯--(BUSINESS WIRE)--(美國商業資訊)-- Kioxia Corporation是Kioxia Holdings Corporation(東京證券交易所代號:285A)旗下子公司,其與Sandisk Corporation(納斯達克代號:SNDK)今日宣布,位於日本岩手縣北上工廠的Fab2(K2)已開始生產其第10代3D快閃記憶體技術產品。這一里程碑象徵著兩家公司繼續推動具重大意義的多年度位元增長,以應對市場對其創新快閃記憶體技術的強勁需求。 配合投產,兩家公司為K2廠房舉行了揭幕儀式。該廠房於2025年9月啟用,此前一直生產兩家公司的第8代3D快閃記憶體產品,並將隨着引入第10代產品而開始擴大生產規模。這兩代3D快閃記憶體均採用創新的CBA(CMOS直接鍵合於陣列)技術,具備高效能、高容量及低功耗的特點。 Fab2廠房採用具備吸震功能的建築結構,其設計亦採用最先進的節能製造設備。該廠房藉助人工智慧以提升生產效率,並採用高空間利用率的設施設計,從而擴大了其潔淨室內可用於裝設製造設備的空間。 Kioxia與Sandisk近期宣布將其合資企業架構延長至2...