

Newsroom
Sorted by: Latest
-
Riassunto: Il mercato cinese del commercio live da circa 900 miliardi di dollari ora si avvicina alle dimensioni dell'e-commerce statunitense
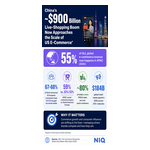
CHICAGO--(BUSINESS WIRE)--Il centro di gravità nel commercio al dettaglio globale è passato all'Oriente. I formati che attualmente guidano la crescita più rapida nel commercio retail globale (live shopping, social commerce e consegne nel giro di minuti) sono stati originati in Asia, e la maggior parte dei consumatori occidentali devono ancora adattarli. Secondo NIQ (NYSE: NIQ), un leader globale nella consumer intelligence, nel suo rapporto globale The Commerce Revolution: Where East Meets West...

-
中国近9000亿美元直播电商市场规模已接近美国整体电商市场体量
芝加哥--(BUSINESS WIRE)--(美国商业资讯)-- 全球零售格局的重心正加速向东方转移。如今引领全球零售增长最快的商业模式——直播购物、社交电商和分钟级即时配送——均率先诞生于亚洲并实现规模化发展,而大多数西方消费者尚未真正采纳这些消费模式。全球领先的消费者洞察公司NIQ(纽约证券交易所代码:NIQ)在其最新发布的全球报告《商业变革:东西方交汇之处》中指出,东西方市场之间的差距依然十分显著。 这一市场的体量已十分庞大。报告援引的市场数据显示,仅中国直播电商市场在2025年的规模便达到约9000亿美元,已逼近美国整个电子商务市场的规模。 然而,北美地区68%的消费者和欧洲67%的消费者从未通过社交媒体购买过商品,约三分之二的消费者也从未使用过即时零售服务。与此同时,亚太地区正快速领跑全球电商发展,目前占全球电子商务市场总规模近55%。在这一趋势下,若西方品牌和零售商仍将直播电商、社交电商和即时零售视为试验性渠道,而非未来商业发展的核心方向,便可能在竞争中逐渐落后。而人工智能(AI)的迅猛发展,正进一步加速这一变革。 不容忽视的关键数据 东方已成为全球电商发展的重心。2025...

-
O mercado de live-commerce da China, avaliado em cerca de US$ 900 bilhões, agora se aproxima da escala do e-commerce dos EUA
CHICAGO--(BUSINESS WIRE)--O centro de gravidade do varejo global deslocou-se para o Oriente. Os formatos que agora impulsionam o crescimento mais rápido do varejo global (compras ao vivo, comércio social e entrega em minutos) foram pioneiros e escalados na Ásia, e a maioria dos consumidores ocidentais ainda não os adotou. De acordo com a NIQ (NYSE: NIQ), uma empresa líder em inteligência de consumo, em seu relatório global A Revolução do Comércio: Onde o Oriente encontra o Ocidente, a lacuna en...

-
Samenvatting: De Chinese live-commerce-markt van omstreeks $ 900 miljard is nu bijna zo omvangrijk als de Amerikaanse e-commerce
CHICAGO--(BUSINESS WIRE)--Het zwaartepunt van de wereldwijde detailhandel is naar het Oosten verschoven. De formules die momenteel de snelste groei in de wereldwijde detailhandel aansturen (live shopping, social commerce en bezorging binnen enkele minuten) zijn in Azië ontwikkeld en op grote schaal ingevoerd. De meeste westerse consumenten zien dat nog niet echt in. Volgens NIQ (NYSE: NIQ), een toonaangevend bedrijf op het gebied van consumentenonderzoek, is de kloof tussen Oost en West nog ste...

-
中國約 9,000 億美元的直播電商市場規模現已逼近美國電子商務市場規模
芝加哥--(BUSINESS WIRE)--(美國商業資訊)-- 全球零售業的重心已轉向東方。目前推動全球零售業最快成長的模式(直播購物、社群電商和分鐘級配送)均率先在亞洲開創並實現規模化,而大多數西方消費者尚未採用這些模式。根據領先的消費者洞察公司 NIQ(NYSE: NIQ)發布的全球報告 The Commerce Revolution: Where East Meets West,東西方之間的差距仍然十分巨大。 其規模已相當可觀。根據該報告引用的市場資料,僅中國的直播電商市場於 2025 年的規模就約達 $9,000 億,已接近整個美國電子商務市場的規模。 然而,北美有 68% 的消費者從未透過社群媒體購買過產品,歐洲則有 67% 的消費者從未如此做過,約三分之二的消費者也從未使用過即時電商。隨著亞太地區持續領先,目前已占全球電子商務總量近 55%,仍將這些管道視為試驗的西方品牌和零售商,恐將被市場拋在後頭。而 AI 正加速這一轉變。 The "must-know" numbers(不可不知的數據) 東方是全球電子購物的重鎮。 2025 年,亞太地區約占全球電子商務營收的 55%...

-
سوق التجارة الإلكترونية المباشرة في الصين، الذي تبلغ قيمته حوالي 900 مليار دولار، يقترب الآن من حجم التجارة الإلكترونية في الولايات المتحدة
شيكاغو--(BUSINESS WIRE)--مما لا شك فيه أن مركز الثقل في تجارة التجزئة العالمية قد انتقل إلى الشرق. ولقد تم ابتكار النماذج التي تقود الآن أسرع حالات النمو في تجارة التجزئة العالمية (التسوق المباشر، والتجارة الاجتماعية، والتوصيل في دقائق) وتوسيع نطاقها في آسيا، على أن معظم المستهلكين الغربيين لم يبدؤوا في الاستفادة منها بعد. وفقًا لـ NIQ (المدرجة في بورصة نيويورك بالرمز: NIQ) وهي شركة رائدة في مجال معلومات المستهلك، في تقريرها العالمي بعنوان The Commerce Revolution: Where East Meets West(ثورة التج...

-
中国のライブコマース市場、約9,000億米ドル規模に――米国のEC市場全体に迫る
シカゴ--(BUSINESS WIRE)--(ビジネスワイヤ) -- 世界の小売市場の重心は東へと移りつつあります。現在、世界の小売市場で最も高い成長を牽引しているライブコマース、ソーシャルコマース、即時配送を特徴とするクイックコマースといった販売形態は、アジアで生まれ、大規模に普及しました。一方で、西側諸国の消費者の多くは、こうした購買形態をまだ利用していません。消費者インテリジェンス分野をリードするNIQ(NYSE:NIQ)が発表したグローバルレポート「The Commerce Revolution: Where East Meets West」によると、東西の隔たりは依然として大きいことが明らかになりました。 その市場規模はすでに極めて大きくなっています。同レポートが引用する市場データによると、中国のライブコマース市場は2025年に約9,000億米ドル規模に達し、米国のEC市場全体に迫っています。 一方で、北米の消費者の68%、欧州の67%はソーシャルメディア経由で商品を購入した経験がなく、約3分の2はクイックコマースも利用したことがありません。アジア太平洋地域が世界のEC市場...
-
Le marché chinois du commerce en direct, estimé à environ 900 milliards de dollars, approche désormais l’ampleur du commerce électronique américain
CHICAGO--(BUSINESS WIRE)--Le centre de gravité du commerce de détail mondial s’est déplacé vers l’Est. Les formats qui génèrent aujourd’hui la croissance la plus rapide dans le commerce de détail mondial (achats en direct, commerce social et livraison en quelques minutes) ont été lancés et développés à grande échelle en Asie, et la plupart des consommateurs occidentaux ne les ont pas encore adoptés. Selon NIQ (NYSE : NIQ), une société leader dans le domaine de l’intelligence consommateur, dans...

-
Heart Care Centers of Illinois: Notice of Data Security Incident
PALOS PARK, Ill.--(BUSINESS WIRE)--Heart Care Centers of Illinois (“HCCI”), located at 13011 S. 104th Avenue, Suite 100, Palos Park, IL 60464, is issuing this notice about a data security incident that may have resulted in unauthorized access to certain personal and protected health information of its employees and patients. Please know that HCCI moved swiftly to investigate and remediate the incident. Information about the incident, HCCI’s response, and the steps you may take to help protect y...
-
Incyte Data to Be Highlighted in Four Rapid Oral Presentations at the European Society for Medical Oncology (ESMO) Congress 2026 Support Efforts to Improve Outcomes in Difficult-to-Treat Cancers
WILMINGTON, Del.--(BUSINESS WIRE)--Incyte Data to Be Highlighted in Four Rapid Oral Presentations at ESMO 2026 Support Efforts to Improve Outcomes in Difficult-to-Treat Cancers...