

Newsroom
Sorted by: Latest
-
Mitsubishi Electric to Support Earthquake Relief in Kumamoto
TOKYO--(BUSINESS WIRE)--Mitsubishi Electric Corporation (TOKYO: 6503) announced today that the Mitsubishi Electric Group will donate a total of 50 million yen (approximately U.S.$ 306,000) to aid victims of earthquakes that struck Kumamoto in Japan. The group also plans to make additional donations through Mitsubishi Electric SOCIO-ROOTS Fund, a gift-matching program which matches and doubles donations from employees. The Mitsubishi Electric Group expresses its deepest sympathies to all those a...
-
Pet Service Holding Reports Strong Operational Performance in H1 2026 With Revenue Up +8% to €7.4 Million and Confirms Annual Revenue Outlook of €17–18 Million
ZAANSTAD, Netherlands--(BUSINESS WIRE)--Regulatory News: Pet Service Holding NV (Euronext Growth Paris, ISIN: NL0015001HZ9 / Ticker: ALPET), active in the European market for veterinary products, animal healthcare, and premium pet supplies (the “Company” or “PSH”), today announces its half year revenue to June 30, 2026. H1 2026 revenue up +8% to €7.4 million During the first half of 2026, Pet Service Holding pursued its long-term growth strategy while successfully adapting to changing market co...
-
Pet Service Holding annonce de solides performances opérationnelles au premier semestre 2026, avec un chiffre d'affaires en hausse de +8% à 7,4 M€, et confirme ses prévisions de revenus annuels entre 17 et 18 M€
ZAANSTAD, Pays-Bas--(BUSINESS WIRE)--Regulatory News: Pet Service Holding NV (Euronext Growth Paris, ISIN : NL0015001HZ9 / Mnémonique : ALPET), société active sur le marché européen des produits vétérinaires, des soins de santé animale et des fournitures haut de gamme pour animaux de compagnie (ci-après dénommée « la Société » ou « PSH »), annonce aujourd’hui son chiffre d’affaires semestriel au 30 juin 2026. Chiffre d'affaires du premier semestre 2026 en hausse de +8% à 7,4 M€ Au cours du prem...
-
Air India, SkyDrive and Suzuki Sign MoU for Feasibility Study of Medical Air Logistics in India
TOYOTA, Japan--(BUSINESS WIRE)--Air India Limited (hereinafter, “Air India”), India’s leading global airline, SkyDrive Inc. (hereinafter, “SkyDrive”), a company engaged in the development, manufacture, and sales of eVTOL aircraft, and Suzuki Motor Corporation (hereinafter, “Suzuki”) have signed a memorandum of understanding (MoU) to conduct a joint feasibility study on the use of eVTOL aircraft for medical air logistics in India. India’s major cities face severe traffic congestion, creating sig...

-
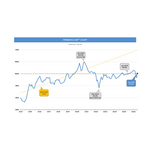
PRIMERICA HOUSEHOLD BUDGET INDEX™ (HBI™): Purchasing Power for Middle-Income Americans Saw Modest Gains in June as Gas Prices Fell
DULUTH, Ga.--(BUSINESS WIRE)--The latest Primerica Household Budget Index™ (HBI™) data, a monthly economic metric that examines how inflation and wage trends impact the ability of middle-income families to afford life’s everyday necessities, is estimated at 100.1% in June, up 1.8% from May and up 0.2% from a year ago. The increase in purchasing power was driven primarily by lower gas prices in June. Small declines in health care costs and modest reductions in auto insurance rates also contribut...
-
Shareholder Alert - Robbins LLP Informs Investors of the Bloom Energy Corporation Class Action Lawsuit
SAN DIEGO--(BUSINESS WIRE)--Robbins LLP informs investors that a securities class action has been filed on behalf of all persons and entities that purchased or otherwise acquired Bloom Energy Corporation (NYSE: BE) securities between February 27, 2025 and July 8, 2026 (the "Class Period").Bloom Energy designs, manufactures, sells, and installs solid oxide fuel cell systems for on-site power generation in the United States and internationally. Scandium is a rare earth metal used as a dopant to st...

-
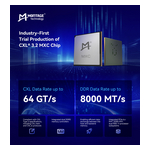
瀾起科技率先試製CXL® 3.2記憶體擴充控制器
廣東橫琴--(BUSINESS WIRE)--(美國商業資訊)-- 瀾起科技今日宣布,率先在業界試製CXL® 3.2記憶體擴充控制器(MXC)晶片。該產品針對人工智慧、雲端運算、資料中心等場景的記憶體擴充與資源池化需求,旨在透過CXL技術協助客戶建構更高容量、更高利用率、更加靈活的記憶體基礎架構。 瀾起科技的CXL 3.2記憶體擴充控制器支援CXL Type 3規格的CXL.mem和CXL.io協議,以PCIe® 6.x和CXL 3.2協議為基礎設計,最高支援64 GT/s資料傳輸速率。產品整合雙DDR5記憶體控制器,可支援最高8000 MT/s的 DDR5記憶體,透過將主機側CXL記憶體請求即時轉換為DDR存取指令,實現主機與後端記憶體間的高效資料互動,從而突破傳統伺服器的記憶體容量限制。 此外,該晶片整合了PCIe 6.x PHY、DDR5 PHY、雙 RISC-V處理器子系統及豐富的管理介面,可支援開發PCIe標準插卡(AIC)、EDSFF等多種型式的CXL記憶體擴充產品,為記憶體擴充、記憶體池化和分層記憶體架構等新型記憶體應用提供關鍵支撐。 瀾起科技總裁Stephen Tai先...
-
UNITE HERE Local 11 Releases Letter Urging Greene County Ohio Board of Commissioners and Captain Tony Buschur to Consider Aramark’s Problematic Track Record in Prison Food Service and Award Contract to Alternate Provider
PHOENIX--(BUSINESS WIRE)--UNITE HERE Local 11 urges Greene County, Ohio to consider Aramark’s track record in prison food service and award the contract to another provider....

-
BE CLASS ACTION NOTICE: Glancy Prongay Wolke & Rotter LLP Files Securities Fraud Lawsuit On Behalf Of Bloom Energy Corporation Investors
LOS ANGELES--(BUSINESS WIRE)--GPWR files securities fraud class action on behalf of BE investors. Contact firm before 9/28/26....
-
Dream expande su plataforma de gestión de activos con la adquisición de Chancerygate, uno de los principales gestores y promotores de activos industriales del Reino Unido
TORONTO y LONDRES--(BUSINESS WIRE)--Dream Unlimited Corp. ("Dream") (TSX: DRM) anunció hoy que Dream y Dream Industrial Real Estate Investment Trust ("Dream Industrial REIT") (TSX: DIR.UN), han firmado los acuerdos definitivos para que Dream adquiera Chancerygate Limited ("Chancerygate" o " CG"), un promotor y gestor de activos industriales con sede en el Reino Unido que cuenta con una trayectoria de 30 años en el sector de los inmuebles industriales multiarrendatarios (MLI). Actualmente, Chanc...