

Newsroom
Sorted by: Latest
-
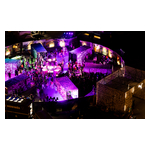
PUMA與Salehe Bembury攜手在The Row DTLA舉辦沉浸式聲音體驗活動,迎接今夏頂尖足球盛宴
洛杉磯--(BUSINESS WIRE)--(美國商業資訊)-- 全球運動品牌PUMA與具有遠見卓識的設計師Salehe Bembury攜手在The Row DTLA舉辦了一場沉浸式體驗活動,在今夏頂尖足球盛宴開幕前夕,共慶雙方的強強聯手。此次活動將這座歷史悠久的場館改造為一系列互動空間,讓嘉賓深入領略這一合作背後的創意世界。活動以洛杉磯為背景,透過聲音與設計的視角,將足球文化從賽場延伸至日常生活。PUMA x SALEHE BEMBURY聯名系列開啟了PUMA今夏足球產品發表計畫的第二篇章。此前,PUMA已於三月發表了11支國家隊的全新球衣。此次更偏向街頭服飾風格的發表,為這11支參賽國家隊帶來了專屬旅行服飾系列及守門員球衣。 當晚,包括Salehe Bembury和迦納饒舌歌手、模特兒Black Sherif在內的眾多創意人士、運動員及文化意見領袖,透過互動及可自訂的體驗環節探索了PUMA x Salehe Bembury TRVL WEAR聯名系列。活動亮點包括「Hidden Frequencies」(隱藏頻率)球鞋揭秘環節,近距離展示了Velum 1 Akita鞋款的紫外線感光...
-
Command the Clone Wars’™ Most Cunning Operatives in Star Wars Zero Company™, Launching August 27
REDWOOD CITY, Calif.--(BUSINESS WIRE)--Electronic Arts Inc. (NASDAQ: EA) today announced that Star Wars Zero Company™, a single-player turn-based tactics game, developed by Bit Reactor in collaboration with Lucasfilm Games, will be available on PC, PlayStation® 5 and Xbox Series X|S starting August 27, 2026. Pre-Orders are now available on all platforms. A new gameplay trailer delivers an action-packed look at the game’s gritty, cinematic take on turn-based tactics while previewing an original...

-
FINAL FANTASY VII REVELATION Announced — Experience the Journey’s End in Spring 2027
LOS ANGELES--(BUSINESS WIRE)--At Summer Game Fest Live, SQUARE ENIX® announced FINAL FANTASY™ VII REVELATION, the third and final entry in the epic, critically acclaimed FINAL FANTASY VII Remake Series. FINAL FANTASY VII REVELATION will release in Spring 2027 simultaneously for PlayStation®5, Nintendo Switch™ 2, XBOX Series X|S and PC via Steam, Epic Games Store and XBOX PC. During the presentation, Director Naoki Hamaguchi and Matt Mercer, the English voice of Vincent Valentine, debuted the of...
-
PUMA与Salehe Bembury携手在The Row DTLA举办沉浸式声音体验活动,迎接今夏顶级足球盛宴
洛杉矶--(BUSINESS WIRE)--(美国商业资讯)-- 全球运动品牌PUMA与具有远见卓识的设计师Salehe Bembury携手在The Row DTLA举办了一场沉浸式体验活动,在今夏顶级足球盛宴开幕前夕,共庆双方的强强联手。此次活动将这座历史悠久的场馆改造为一系列互动空间,让嘉宾深入领略这一合作背后的创意世界。活动以洛杉矶为背景,通过声音与设计的视角,将足球文化从赛场延伸至日常生活。PUMA x SALEHE BEMBURY联名系列开启了PUMA今夏足球产品发布计划的第二篇章。此前,PUMA已于三月发布了11支国家队的全新球衣。此次更偏向街头服饰风格的发布,为这11支参赛国家队带来了专属旅行服饰系列及守门员球衣。 当晚,包括Salehe Bembury和加纳说唱歌手、模特Black Sherif在内的众多创意人士、运动员及文化意见领袖,通过互动及可定制的体验环节探索了PUMA x Salehe Bembury TRVL WEAR联名系列。活动亮点包括“Hidden Frequencies”(隐藏频率)球鞋揭秘环节,近距离展示了Velum 1 Akita鞋款的紫外线感光特...

-
PUMA e Salehe Bembury realizam experiência imersiva inspirada no som antes do maior torneio de futebol no The Row DTLA
LOS ANGELES--(BUSINESS WIRE)--A empresa global de artigos esportivos PUMA e o designer visionário Salehe Bembury organizaram uma experiência imersiva no The Row DTLA para celebrar sua colaboração antes do maior torneio de futebol do mundo. A ativação transformou o local histórico em uma série de ambientes interativos, proporcionando aos convidados uma visão privilegiada do universo criativo por trás da parceria. Com Los Angeles como pano de fundo, o evento levou o futebol para além do campo e p...

-
PUMAとサレへ・ベンバリー、世界最大級のサッカー大会を前にロサンゼルスで没入型サウンド体験イベントを開催
ロサンゼルス--(BUSINESS WIRE)--(ビジネスワイヤ) -- グローバルスポーツブランドのPUMAと、著名デザイナーのサレへ・ベンバリーは、世界最大級のサッカー大会を前に、両者のコラボレーションを記念した没入型体験イベントを、ロサンゼルスの「The Row DTLA」で開催しました。本イベントでは、歴史的建造物を舞台に、会場全体が複数のインタラクティブな空間へと変貌し、来場者はコラボレーションのクリエイティブな世界観を体感しました。ロサンゼルスを背景に、サウンドとデザインという視点を通じて、サッカーをピッチの外の日常生活へと拡張する試みが展開されました。PUMA x Salehe Bemburyコラボレーションは、PUMAが今夏展開するサッカー関連展開の第2弾として始動するものです。3月に発表された11カ国のナショナルチームユニフォームに続く取り組みとして、今回はストリートウェア色を強めたトラベルウェアおよびゴールキーパーキットを、PUMA契約の11の代表チーム向けに展開します。 イベント当日は、サレへ・ベンバリーをはじめ、ガーナ出身のラッパー兼モデルであるブラック・シ...

-
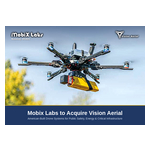
Mobix Labs przejmie Vision Aerial, producenta dronów wytwarzanych w USA, rozszerzając tym samym działalność na globalne rynki dronów i pozyskiwania danych wywiadowczych z powietrza
IRVINE, Kalifornia--(BUSINESS WIRE)--Mobix Labs, Inc. (Nasdaq: MOBX) przekazał dzisiaj informację o podpisaniu wiążącego listu intencyjnego w sprawie przejęcia Vision Aerial, Inc., cieszącego się zaufaniem producenta amerykańskich dronów z siedzibą w Montanie, którego drony są wykorzystywane w operacjach związanych z bezpieczeństwem narodowym, w administracji rządowej, w energetyce, w operacjach związanych z bezpieczeństwem publicznym oraz operacjach w zakresie infrastruktury krytycznej. Wraz z...
-
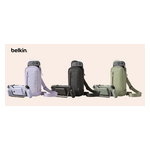
Belkin擴充Nintendo Switch 2配件生態系統,推出全新Charging Grip與Travel Bag
洛杉磯--(BUSINESS WIRE)--(美國商業資訊)-- 今日,擁有40年歷史的領先消費電子品牌Belkin宣布,擴展其Nintendo Switch 2配件生態系統,推出Gaming Charging Grip for Nintendo Switch 2與Gaming Travel Bag for Nintendo Switch 2。 繼今年1月推出並獲獎的Charging Case Pro之後,這些新配件進一步擴展Belkin持續成長的遊戲產品線,為玩家提供更多方式,在任何遊玩地點為遊戲設備供電、保護與攜帶其遊戲必備配件。 在2025年6月進入遊戲配件領域後,Belkin持續以精心設計的產品擴展其生態系統,這些產品結合高級材質、實用創新與可靠效能。最新推出的產品旨在提升掌上遊戲體驗,讓隨時隨地遊戲變得比以往更加便利。 Belkin未來業務部門產品管理總監Logan Olson表示:「遊戲是Belkin在行動電源與高端配件領域傳承的自然延伸。自去年進入這個市場以來,我們一直專注於設計能解決消費者實際需求的產品,而這些新產品進一步擴展我們的Nintendo Switch 2生態...
-
A Mobix Labs felvásárolja az amerikai Vision Aerial dróngyártó céget, amivel belép a globális drón- és légi hírszerzési piacokra
IRVINE, Kalifornia--(BUSINESS WIRE)--A Mobix Labs, Inc. (Nasdaq: MOBX) a mai napon bejelentette, hogy kötelező érvényű szándéknyilatkozatot írt alá a Vision Aerial, Inc., montanai székhelyű vállalat felvásárlására, amely nemzetbiztonsági, kormányzati, energetikai, közbiztonsági és kritikus infrastrukturális műveletekben használt amerikai drónokat gyárt. A felvásárlás révén a Mobix Labs belép a gyorsan növekvő globális piacra, amely a korábban bejelentett, célzott, kritikus fontosságú felvásárlá...

-
Mobix Labs、米国製ドローン・メーカーのVision Aerialを買収へ、世界のドローン市場および航空インテリジェンス市場に進出
カリフォルニア州アーバイン--(BUSINESS WIRE)--(ビジネスワイヤ) -- Mobix Labs, Inc.(Nasdaq:MOBX)は、Vision Aerial, Inc.を買収する法的拘束力のある意向表明書に署名したと発表しました。Vision Aerialは、国家安全保障、政府機関、エネルギー、公共安全、重要インフラの各分野で信頼されている米国製ドローンを製造する、モンタナ州に拠点を置く企業です。今回の買収により、Mobix Labsは急成長するグローバル市場に参入します。これは、対象を絞った重要性の高い買収を通じて成長を図るという、Mobix Labsが以前発表した戦略における最新の取り組みです。 米国製。性能が問われる現場で培った信頼。 2013年設立のVision Aerialは、極めて過酷な現場業務に対応する堅牢なドローン・システムの設計、製造、サポートを手掛けています。各機体には、交換可能なカメラやセンサーを搭載できます。搭載可能な機器は、高解像度カメラ、熱検知用サーマル・カメラ、レーザーを利用した3次元マッピング用センサー、ガス漏れ検知用センサーなど...
