

Newsroom
Sorted by: Latest
-
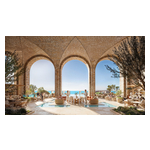
Modon Holding與Nammos Hotels & Resorts將Nammos拉斯赫克馬專案帶到埃及北海岸
埃及拉斯赫克馬--(BUSINESS WIRE)--(美國商業資訊)-- 總部位於阿布達比的Modon Holding與Nammos Hotels & Resorts宣布推出Nammos拉斯赫克馬——這是該知名生活型態和款待品牌在埃及的第一個完全整合式目的地。該專案位於瓦迪葉姆(Wadi Yemm)區域內,將使拉斯赫克馬「永恆的地中海生活」承諾成為現實,融合Nammos住宅、Nammos度假村、Nammos村以及一系列精心策畫的全天候餐飲和康養體驗,其中包括享譽全球的Nammos餐廳和海灘俱樂部。 Nammos拉斯赫克馬是對當代地中海奢華生活的全新詮釋。這一目的地既反映了埃及北海岸的自然美景,又體現了Nammos所代表的精緻而充滿活力的生活型態。它引進了一種受地中海精神啟發的生活構想,將建築、景觀、藝術和款待服務無縫融合為一個整體環境。 Nammos住宅將包括72套一至四居室公寓和一套頂層公寓,而Nammos度假村將提供79間客房,分為五個類別,從初級套房、一居室和兩居室套房到總統套房和慶典套房,應有盡有。住戶和賓客將可享用精心打造的款待、康養、零售和休閒設施,在埃及北海岸新興...

-
Icertis Announces CEO Transition
BELLEVUE, Wash.--(BUSINESS WIRE)--Icertis, the global leader in AI-native contract intelligence, today announced that its Board of Directors has appointed Rajat Bahri, Chief Financial Officer, and Jim Moffatt, a seasoned Chief Executive Officer and Icertis Board Member, as Interim co-CEOs. Moffatt has also been appointed Chair of the Icertis Board of Directors and Bahri will continue serving as CFO to execute on the company’s strategy and drive sustained growth. Anand Subbaraman, who joined Ice...
-
Colgate-Palmolive Webcasts 2026 Second Quarter Earnings Conference Call July 31, 2026 – 8:30 a.m. ET
NEW YORK--(BUSINESS WIRE)--Colgate-Palmolive Company (NYSE:CL) will provide a live webcast of its 2026 second quarter earnings conference call on Friday, July 31, 2026, at 8:30 a.m. ET. The call will be hosted by Chairman, President and CEO, Noel Wallace, Chief Financial Officer, Stan Sutula, Executive Vice President, Investor Relations, Claire Ross, and Executive Vice President, M&A and Special Projects, John Faucher. Investors may access the earnings press release, prepared materials and...
-
AM Best to Sponsor, Exhibit and Speak at Vermont Captive Insurance Association’s Annual Conference
OLDWICK, N.J.--(BUSINESS WIRE)--AM Best will participate in sessions on leading factors affecting the captive insurance industry at the 2026 Vermont Captive Insurance Association’s (VCIA) Annual Conference. AM Best also will participate in other capacities, including as a platinum sponsor of the event. The VCIA conference takes place Aug. 11-13, 2026.During the conference, a group of AM Best analysts - Sharon Marks, director; Connor Brach, associate director; Kourtnie Beckwith, senior financial...
-
Modon Holding与Nammos Hotels & Resorts将Nammos拉斯希克马项目带到埃及北海岸
埃及拉斯希克马--(BUSINESS WIRE)--(美国商业资讯)-- 总部位于阿布扎比的Modon Holding与Nammos Hotels & Resorts宣布推出Nammos拉斯希克马——这是该知名生活方式和款待品牌在埃及的首个完全一体化目的地。该项目位于瓦迪耶姆(Wadi Yemm)区域内,将使拉斯希克马“永恒的地中海生活”承诺成为现实,融合了Nammos住宅、Nammos度假村、Nammos村以及一系列精心策划的全天候餐饮和康养体验,其中包括享誉全球的Nammos餐厅和海滩俱乐部。 Nammos拉斯希克马是对当代地中海奢华生活的全新诠释。这一目的地既反映了埃及北海岸的自然美景,又体现了Nammos所代表的精致而充满活力的生活方式。它引入了一种受地中海精神启发的生活理念,将建筑、景观、艺术和款待服务无缝融合为一个整体环境。 Nammos住宅将包括72套一至四居室公寓和一套顶层公寓,而Nammos度假村将提供79间客房,分为五个类别,从初级套房、一居室和两居室套房到总统套房和庆典套房,应有尽有。住户和宾客将可享用精心打造的款待、康养、零售和休闲设施,在埃及北海岸新兴...
-
First Trust Global Funds PLC UK Regulatory Announcement: Net Asset Value(s)
LONDON--(BUSINESS WIRE)-- Funds Date TIDM ISIN Code Shares in Issue Currency Net Asset Value NAV/per Share First Trust US Equity Opportunities UCITS ETF 16.07.2026 FPX. IE00BYTH6238 250,002.00 USD 17,100,697.87 68.402 ...
-
Catching Cancer Earlier, One Breath at a Time: SpotitEarly Partners with HITLAB to Accelerate Its U.S. Launch
ENGLEWOOD, N.J.--(BUSINESS WIRE)--When breast cancer is caught while it is still confined to the breast, the five-year relative survival rate is about 99%. Once it has spread to distant parts of the body, that figure falls to roughly 31%, according to the National Cancer Institute. SpotitEarly is working to move far more patients into that first group with a screening test as simple as breathing into a mask. Today, the multi-cancer early-detection company announced a strategic partnership with...

-
Update: Jackson to Report Second Quarter 2026 Financial Results on August 3
LANSING, Mich.--(BUSINESS WIRE)--Jackson Financial Inc.1 (NYSE: JXN) (Jackson®) today announced that it will release second quarter 2026 financial results after market close on Monday, August 3, 2026. Jackson’s press release and supplemental financial materials will be available at investors.jackson.com. Jackson will host a conference call and webcast to discuss the results at 10 a.m. ET on Tuesday, August 4, 2026. The live webcast is open to the public and can be accessed at investors.jackson....
-
NATIXIS UK Regulatory Announcement: Form 8.3
LONDON--(BUSINESS WIRE)-- FORM 8.3 PUBLIC OPENING POSITION DISCLOSURE/DEALING DISCLOSURE BY A PERSON WITH INTERESTS IN RELEVANT SECURITIES REPRESENTING 1% OR MORE Rule 8.3 of the Takeover Code (the “Code”) 1. KEY INFORMATION (a) Full name of discloser: NATIXIS SA (b) Owner or controller of interests and short positions disclosed, if different from 1(a): The naming of nominee or vehicle companies is insufficient. For a trust, the trustee(s), settlor and beneficiaries must be named. (c) Name o...