Newsroom
Sorted by: Latest
-
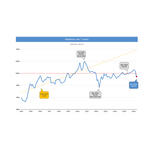
PRIMERICA HOUSEHOLD BUDGET INDEX™ (HBI™): Gas Prices Continued to Weigh on Purchasing Power of Middle-Income Families in May
DULUTH, Ga.--(BUSINESS WIRE)--The latest Primerica Household Budget Index™ (HBI™) data, a monthly economic metric that examines how inflation and wage trends impact the ability of middle-income families to afford life’s everyday necessities, is estimated at 98.3% in May, down 1.1% from April and down 1.7% from a year ago. Gas prices rose in May, remaining the primary driver of declining purchasing power, although growth slowed month-over-month to 8.6% in May from 11% in April. Earned income inc...
-
Oasis Views 2026 AGM Results as Turning Point for Accountability at KADOKAWA (Securities Code: 9468 JT)
HONG KONG--(BUSINESS WIRE)--Oasis Management Company Ltd. (“Oasis”), the investment manager to private funds that own approximately 15.25% of the shares of KADOKAWA CORPORATION (“KADOKAWA” or the “Company”), today comments on the outcome of KADOKAWA’s 2026 Annual General Meeting held on June 24, 2026. While Oasis is deeply disappointed that CEO Takeshi Natsuno was reappointed as a director of the Company, the voting results represent a significant milestone in the campaign for accountability at...
-
オアシス、2026年定時株主総会の議決権行使結果を、KADOKAWAにおける説明責任の徹底に向けた転換点と評価(証券コード:9468 JT)
香港--(BUSINESS WIRE)--(ビジネスワイヤ) -- オアシス・マネジメント・カンパニー・リミテッド(以下「オアシス」または「当社」といいます。)は、株式会社KADOKAWA(証券コード:9468 JT)(以下「KADOKAWA」または「同社」といいます。)の株式を約15.25%保有するファンドの運用会社です。本日、オアシスは2026年6月24日に開催されたKADOKAWAの2026年定時株主総会(以下「本株主総会」といいます。)の結果について、以下の通り声明を発表いたしました。 オアシスは、夏野剛CEOが同社の取締役として再任されたことは誠に遺憾である一方、本株主総会における議決権行使結果は、KADOKAWAの取締役会に対する説明責任を追及していくにあたり極めて重要な一歩となったと確信しています。 本株主総会において、夏野CEOの取締役再任議案に対する賛成率は59.68%に留まり、前年の90.26%から大幅に低下しました。これは、本株主総会において行使された議決権の4割以上が、同氏の取締役としての留任を支持しなかったことを意味しています。日本を代表する上場企業の現職C...
-
Advanced System for Simultaneous, Long-duration, Multi-point Plasma Measurement Developed in Japan
TOKYO--(BUSINESS WIRE)--Mitsubishi Electric Corporation, Kyoto University’s Institute of Advanced Energy, and the National Institute for Fusion Science (NIFS) announced today that they have developed an advanced, world-class microwave plasma measurement system for fusion energy. The system is capable of simultaneously measuring plasma conditions at multiple points over extended periods. The joint team successfully demonstrated the system using the Heliotron J fusion experimental device at Kyoto...
-
FreeCast Signs WIRE3 to Deliver Branded Streaming Platform Across Expanding 100% Fiber Network
ORLANDO, Fla.--(BUSINESS WIRE)--FreeCast, Inc. (Nasdaq: CAST), a provider of next-generation streaming media Platform-as-a-Service (PaaS) solutions, today announced that it has signed an agreement with WIRE3, one of Florida's fastest-growing 100% fiber internet providers, to deliver a customized streaming entertainment platform for WIRE3 subscribers. In addition to serving residential and business customers, WIRE3 will participate as a FreeCast MDU (Multi-Dwelling Unit) partner, enabling apartm...
-
Toshiba Launches 80V N-Channel Power MOSFET Using Its Latest Generation Process to Improve Efficiency in AI Data Centers
KAWASAKI, Japan--(BUSINESS WIRE)--Toshiba launches an 80V N‑channel power MOSFET with its latest process, reducing losses and EMI to improve efficiency in AI data centers....

-
東芝:AIデータセンターの高効率化に貢献する、当社最新世代プロセス採用の80V耐圧NチャネルパワーMOSFET発売について
川崎--(BUSINESS WIRE)--(ビジネスワイヤ) -- 東芝デバイス&ストレージ株式会社は、AIデータセンターや通信基地局などの産業用機器向けスイッチング電源に適した製品として、当社最新世代プロセス[注1]「U-MOS11-H(ユー・モス・イレブン・エイチ)」を採用した、80V耐圧NチャネルパワーMOSFET「TPM1R408RH」を製品化し、本日から出荷を開始します。 AI処理の拡大に伴うデータセンターの電力需要増加や、通信インフラの高度化により、スイッチング電源にはさらなる高効率化と小型化(高電力密度化)、およびEMI[注2]低減が強く求められています。電源の損失はシステム全体の消費電力・発熱・冷却負荷へ直結するため、パワー半導体は、導通損失とスイッチング損失をバランスよく低減することが重要です。さらに、EMI、熱設計、実装性といった複数の課題を考慮した、システム全体の設計最適化への貢献も求められています。 新製品は、素子構造を最適化し、当社従来世代プロセスU-MOSⅩ-Hを採用した80V耐圧の当社既存製品「TPM1R908QM」と比べて、ドレイン・ソース間オン抵抗(...

-
Medisca inicia novo capítulo sob a liderança do fundador Antonio dos Santos
MONTREAL--(BUSINESS WIRE)--Por mais de 35 anos, Santos ajudou a moldar a Medisca como líder global em manipulação farmacêutica. Como CEO, ele liderará a estratégia de longo prazo da empresa, com foco na expansão do alcance global da Medisca, no investimento em novas áreas de crescimento, no fortalecimento de parcerias estratégicas e na continuidade do aprimoramento dos produtos, serviços, educação e expertise que os profissionais de saúde utilizam diariamente. “Quando fundei a Medisca, minha vi...

-
Medisca otwiera nowy rozdział, którym pokieruje założyciel firmy, Antonio Dos Santos
MONTREAL--(BUSINESS WIRE)--Przez ponad 35 lat Dos Santos pomagał w kształtowaniu firmy Medisca jako globalnego lidera w tworzeniu receptur preparatów farmaceutycznych. Obejmując stanowisko dyrektora generalnego, pokieruje on realizacją długoterminowej strategii firmy, koncentrując się na zwiększeniu globalnego zasięgu Medisca, inwestycjach w nowe obszary rozwoju, wzmocnieniu partnerstw strategicznych i dalszym rozwoju produktów, usług, oferty szkoleniowej i wiedzy fachowej, na których pracownic...

-
Curbline Properties Announces Pricing of Common Stock Offering
NEW YORK--(BUSINESS WIRE)--Curbline Properties Corp. (NYSE: CURB) (the “Company” or “Curbline”) announced today the pricing of an underwritten public offering of 10,000,000 shares of its common stock, all of which are being offered in connection with the forward sale agreements described below. The aggregate gross proceeds to the Company from the offering, before deducting estimated offering expenses, are expected to be approximately $308.5 million. The offering is expected to close on July 1,...