

Newsroom
Sorted by: Latest
-
Citibank UK Regulatory Announcement: FRN Variable Rate Fix
LONDON--(BUSINESS WIRE)-- Re: Bank of America Corporation - BAC EMTN EUR 1,250,000,000.00 MATURING: 28-Jan-2028 ISIN: XS2987787939 PLEASE BE ADVISED THAT THE INTEREST RATE FOR THE PERIOD 28-Apr-2026 TO 28-Jul-2026 HAS BEEN FIXED AT 2.69 PCT DAY BASIS: ACTUAL/360 INTEREST PAYABLE VALUE 28-Jul-2026 WILL AMOUNT TO: EUR 8,509,131.94 PER EUR 1,250,000,000.00 DENOMINATION ...
-
Copper Property CTL Pass Through Trust Termination Date Extended
JERSEY CITY, N.J.--(BUSINESS WIRE)--Copper Property CTL Pass Through Trust (“the Trust”) has filed a Form 14-C announcing that the Trust Agreement has been amended to extend the Trust Termination Date by 60 days to June 29, 2026, by written consent of the majority of the Certificateholders. Additional information, including the Trust’s Monthly and Quarterly Reports, as well as other filings with the Securities and Exchange Commission (“SEC”) can be accessed via the Trust’s website at www.ctltru...
-
JBL庆祝成立80周年,持续为声音表达注入力量
美国洛杉矶--(BUSINESS WIRE)--(美国商业资讯)-- HARMAN旗下标志性音频品牌JBL迎来成立80周年重要里程碑。八十年来,JBL始终致力于提供打动人心的声音体验,持续以卓越音质影响一代又一代用户。 引领行业的传承 自1946年由富有远见的工程师James B. Lansing创立以来,JBL始终引领音频创新发展,树立行业标杆。从专业录音棚、家庭娱乐系统,到为Woodstock与Tomorrowland等标志性文化盛事提供声音支持,JBL始终坚持呈现真实纯粹、未经修饰的声音体验。 如今,JBL的品牌影响力已遍及全球,稳居个人音频领域的领先地位。数以亿计的用户通过JBL便携式音箱与耳机,畅享所热爱的音乐体验。与此同时,JBL Professional持续为全球逾40%的影院提供专业音频支持,并广泛应用于体育场馆、录音棚及各类音乐演出场地等场景,致力于让高品质声音触达每一位听众……甚至延伸至车载空间。 HARMAN Lifestyle事业部总裁Dave Rogers表示:“80年来,JBL所积淀的工程技术传承始终引领高保真音频的发展,这一标准亦体现在当今每一款JBL产品...
-
Doskonałe brzmienie od 80 lat dzięki JBL
LOS ANGELES--(BUSINESS WIRE)--JBL, kultowy producent nagłośnienia należący do HARMAN, świętuje 80-letnią rocznicę działalności, a tym samym osiem dekad doskonałego brzmienia, które odcisnęło piętno na wielu pokoleniach. Przywództwo od lat JBL, którą w 1946 r. założył wizjonerski inżynier James B. Lansing, od samego początku wyznaczała standardy pod względem innowacji w dziedzinie dźwięku. Od profesjonalnych studiów nagrań i wyposażenia domowego po obsługę niezapomnianych wydarzeń kulturalnych,...
-
JBL、声を響かせ続けて80周年
ロサンゼルス--(BUSINESS WIRE)--(ビジネスワイヤ) -- ハーマン(HARMAN)の象徴的なオーディオブランドであるJBLは、世代を超えて人々の心を動かすサウンドを提供してきた節目となる80周年を迎えました。 リーダーシップの系譜 1946年に先見的なエンジニアであるジェームズ・B・ランシングによって設立されて以来、JBLはオーディオイノベーションの基準を打ち立ててきました。プロフェッショナル向けレコーディングスタジオやホームエンターテインメントから、さらにウッドストックやトゥモローランドのような伝説的なカルチャーイベントを支える場面に至るまで、JBLは常に本物の、ありのままのサウンドの提供に取り組んできました。 現在、JBLの影響力は他に類を見ません。数億人の人々がJBLのポータブルスピーカーやヘッドホンを通じて愛する音楽を楽しんでおり、JBLはパーソナルオーディオ分野における世界的リーダーとしての地位を確立しています。また、JBL Professionalは世界の映画館の40%以上の音響を支え続けており、スタジアム、レコーディングスタジオ、音楽会場などにも音響ソ...
-
Společnost JBL slaví 80 let, kdy dává hlasům sílu
LOS ANGELES--(BUSINESS WIRE)--JBL, ikonická audio značka společnosti HARMAN, slaví 80. výročí, čímž si připomíná osm desetiletí, během nichž přináší zvuk, který oslovuje celé generace. Dědictví vedoucího postavení Společnost JBL založil v roce 1946 vizionářský inženýr James B. Lansing a od té doby udává standardy v oblasti inovací v audio technologiích. Od profesionálních nahrávacích studií a domácí zábavy až po ozvučení legendárních kulturních událostí, jako jsou Woodstock a Tomorrowland, se J...
-
Roadside Development Expands Beyond DMV With First Acquisition in Pennsylvania
WASHINGTON--(BUSINESS WIRE)--Roadside Development, a Washington, D.C.–based real estate investment and development firm known for its retail-driven, mixed-use and adaptive reuse projects, today announced the acquisition of the Galleria of Mt. Lebanon in Pittsburgh, Pennsylvania. The transaction marks Roadside Development’s first investment outside of the D.C., Maryland and Virginia region and represents a significant step in its broader expansion strategy. The Galleria of Mt. Lebanon is an appr...

-
Cathay Bank Announces 49th Annual Charity Golf Tournament
LOS ANGELES--(BUSINESS WIRE)--Cathay Bank is excited to announce its upcoming 49th Annual Charity Golf Tournament, that will take place on May 6, 2026 at the Industry Hills Golf Club at Pacific Palms Resort in the City of Industry, California. This annual charity event serves as a long-standing tradition and cornerstone community event, bringing together golf enthusiasts to raise funds to support local nonprofit organizations. The tournament will feature an 18-hole, four-player scramble format,...
-
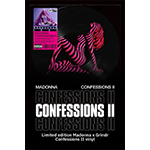
Bitch, I’m Madonna: Madonna Partners with Grindr for Global Launch of Confessions II
WEST HOLLYWOOD, Calif.--(BUSINESS WIRE)--Grindr, the Global Gayborhood in your PocketTM and world’s largest social networking app for gay, bi, trans, and queer people, today announces an exclusive global partnership with Madonna to launch Confessions II, arriving just in time for Pride season. Grindr is one of the few select brand partners to officially partner on the release. Starting today, Madonna takes over the grid - on her terms. Across Grindr, users will experience an evolving in-app tak...
-
Zayo Issues $2.37 Billion of Asset-Backed Term Notes
DENVER--(BUSINESS WIRE)--Zayo, a leading digital infrastructure provider, today announced it has closed on the issuance of $2.37 billion of asset-backed term notes (the “Notes”), issued by subsidiary Zayo Issuer, LLC, and secured by fiber network assets and associated contracts throughout the United States. This is Zayo’s first ABS transaction in 2026 and fourth overall, bringing total ABS debt raised to more than $6 billion. Proceeds from the transaction will primarily be used to repay existin...