Newsroom
Sorted by: Latest
-
Codestrap Redefines Architecture of Agentic Work, Solves AI Cost Crisis
DENVER--(BUSINESS WIRE)--Codestrap, an AI software development company that delivers outcomes not outputs, today announced its managed service offering has solved AI’s affordability crisis. After comparing its performance against public disclosures and research from leading academic and commercial organizations, Codestrap found that its approach radically outperforms industry benchmarks by orders of magnitude. In one recent engagement, Codestrap generated a verified ontological framework, relat...
-
AM Best Assigns Issue Credit Rating to Teachers Insurance and Annuity Association of America’s Forthcoming Surplus Notes
OLDWICK, N.J.--(BUSINESS WIRE)--AM Best has assigned a Long-Term Issue Credit Rating (Long-Term IR) of “aa” (Superior) to the forthcoming $2 billion, 30-year surplus notes to be issued by Teachers Insurance and Annuity Association of America (TIAA) (New York, NY). The outlook assigned to the Credit Rating is stable. The surplus note issuance is for general corporate purposes, which may include in part purchase financing related to TIAA company Nuveen’s cash acquisition of Schroders plc, which w...
-
Seek Labs Maps 25/25 Viral Families through BioSeeker, Advancing a New Model for Sequence-Directed Antiviral Discovery
SALT LAKE CITY--(BUSINESS WIRE)--Seek Labs, a private TechBio company building programmable platforms to decode, program, and resolve diseases, today announced it has mapped CRISPR-addressable regions across 25 out of 25 viral families known to infect humans, creating a comprehensive atlas of viral genetic vulnerabilities that may support faster identification of antiviral target sites against known pathogens, emerging variants, and future outbreak threats. Antiviral development has been reacti...
-
La Chambre de commerce de Dubaï organise 1 460 rencontres B2B lors de ses missions commerciales en Afrique
DUBAÏ, Émirats arabes unis--(BUSINESS WIRE)--La Chambre de commerce de Dubaï, l’une des trois entités réunies sous l’égide de Dubai Chambers, a achevé, avec succès, une série de missions commerciales en Afrique, au cours desquelles 1 460 rencontres d’affaires bilatérales ont été organisées au Ghana, en Éthiopie et en Afrique du Sud. Ces missions ont permis de mettre en relation des entreprises établies à Dubaï avec des partenaires stratégiques à travers le continent africain. Elles ont réuni 45...

-
Amazon Says SES Requires TLS 1.2. Paubox Testing Shows It Doesn't.
SAN FRANCISCO--(BUSINESS WIRE)--Emails sent through Amazon Simple Email Service (SES) can be delivered in plaintext, readable by anyone in transit, and the sender never knows. New testing from Paubox found Amazon SES could deliver protected health information (PHI) in email even when encryption fails. The findings come from How Amazon SES puts PHI at risk, published today by Paubox, a leader in HIPAA compliant email security. Paubox engineers ran 14 controlled tests against Amazon SES in Q2 202...
-
Xtrackers (IE) plc UK Regulatory Announcement: Net Asset Value(s)
LONDON--(BUSINESS WIRE)-- Xtrackers (IE) plc Investment Company with Variable Capital Registered Office: 78 Sir John Rogerson's Quay, Dublin 2, Ireland Registration number: 393802 (the “Company”) NOTICE TO SHAREHOLDERS OF THE SUB-FUNDS LISTED ON THE LONDON STOCK EXCHANGE Dublin, 05 June 2026 This announcement is to inform the shareholders of the sub-funds listed in the table below (each a Sub-Fund, and together the Sub-Funds) (the Shareholders) on behalf of the board of directors of the Compan...
-
emeis : Programme de rachat de titres
PUTEAUX, France--(BUSINESS WIRE)--Regulatory News: emeis (Paris:EMEIS) : Déclaration des transactions sur actions propres Période du 1er au 5 juin 2026 Emetteur : EMEIS (LEI : 969500LHIH3NT7PK1V89) Catégories de titres : actions ordinaires (ISIN : FR001400NLM4) Descriptif du programme mis en ligne sur le site Internet de l’Autorité des Marchés Financiers le 8 juin 2026 Rapport hebdomadaire sur les rachats d'actions du 1er au 5 juin 2026 Nom de l'émetteur Code identifiant de l'émetteur (code L...
-
Registration Continues for the 2026 International Compact Modeling Conference (ICMC)
LONG BEACH, Calif.--(BUSINESS WIRE)--Si2 invites researchers, engineers, and semiconductor industry professionals to join them at the 2026 International Compact Modeling Conference (ICMC)...
-
Kodamai Names AI and Semiconductor Veteran Pankaj Kedia Non-Executive Director as Agentic AI Expands Beyond the Cloud
SAN FRANCISCO & GLASGOW, Scotland--(BUSINESS WIRE)--Kodamai, a pioneer in mathematically rigorous agentic AI, today announced the appointment of Pankaj Kedia as Non-Executive Director on its Board of Directors. The appointment brings Kedia’s deep AI and semiconductor expertise to Kodamai at a pivotal moment in the company’s evolution, as enterprises accelerate their adoption of agentic AI while shifting away from centralized cloud toward heterogeneous, distributed compute environments spanning...

-
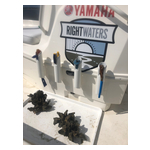
Yamaha Rightwaters Marks Seven Years of Conservation Leadership
KENNESAW, Ga.--(BUSINESS WIRE)--Yamaha Rightwaters™ marked its seventh anniversary on Monday, June 8, World Oceans Day 2026. Launched in 2019, Yamaha Rightwaters continues to support programs that make significant progress in keeping waterways clean and promoting sustainability for generations to come. Several key metrics over the course of the last 12 months include: More than 264.2 tons of debris removed from U.S. lakes, rivers and coastal waters through collaborations with clean up organizat...