LegalShield® Housing Data Points to a Fracturing Market: Foreclosure Pressure Surging in the South, Recovery Taking Hold in the West
LegalShield® Housing Data Points to a Fracturing Market: Foreclosure Pressure Surging in the South, Recovery Taking Hold in the West
- Drawn from 36 million consumer legal intakes, new LegalShield data reveals sharply diverging regional housing markets
- South foreclosure activity up 46.4% YoY at its highest since 2019; Midwest leads the nation in foreclosure inquiries; Northeast remains the most frozen market
- West stands alone as the only U.S. region above pre-pandemic norms across all three housing indices
ADA, Okla.--(BUSINESS WIRE)--The U.S. housing market is splitting in two and geography is the fault line. New LegalShield data, drawn from 36 million consumer legal intakes, shows foreclosure pressure in the South at its highest point since 2019, even as Western markets stand as the only region running above pre-pandemic norms.
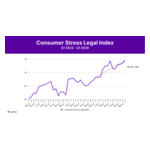
The findings come from the LegalShield Consumer Stress Legal Index, a leading indicator of foreclosure filings, housing starts, and existing-home sales built on U.S. Census Bureau regional definitions. At the end of Q1 the index predicted rising foreclosure activity through mid-2026. The latest foreclosure data confirms that the top three foreclosure rates are in Delaware, South Carolina and Florida, all in the South region.
"What our data is showing is essentially two housing markets inside one country," said Matt Layton, senior vice president of Consumer Analytics for LegalShield. "The West is the lone outperformer — the only region running above pre-pandemic norms across foreclosure, construction, and sales simultaneously. The rest of the country is under pressure, and the South is where that pressure is most acute."
The South: Spiking Foreclosure Pressure
The pressure is most visible in the South, where the Foreclosure Index reached 52.4 in April — up 46.4% year over year and the region's highest reading since October 2019. The spike reflects the back end of the COVID-era boom: the South led the country in building and buying between 2020 and 2022, and the escrow consequences of that surge are now reshaping total monthly payments even on fixed-rate loans.
"What's driving the foreclosure calls in the South isn't the principal and the interest, it's the escrow," said Ben Farrow, LegalShield provider attorney and partner at Anderson, Williams, & Farrow, LLC. "Homeowners insurance and property tax increases have quietly reset the total monthly payment higher on loans people thought were stable. That payment shock is what's moving people from financial stress to legal action."
The April data across all three indices:
- Foreclosure Index: 52.4 (+46.4% YoY) — the region's highest reading since October 2019 and the steepest year-over-year increase of any region
- Housing Construction Index: 107.5 (–3.3% YoY) — builder activity moderating after leading the country during the COVID boom
- Housing Sales Index: 92.7 (+5.7% YoY) — modest improvement but still 10.2% below February 2020
The West: The Outperformer
The West tells a different story. The region is the lone outperformer in the country, running above pre-pandemic norms across all three indices simultaneously — the only region that can make that claim.
"The West is the one part of the country where all three signals are pointing in the right direction at the same time," Layton said. "Construction is above pre-pandemic norms and still growing. Sales are recovering. And even where foreclosure inquiries are rising, the absolute level remains well below the rest of the country. That's a fundamentally different housing environment than what we're seeing in the South or the Midwest."
The April data across all three indices:
- Foreclosure Index: 35.0 (+21.8% YoY) — the lowest regional reading in the country, still 39.6% below February 2020 despite the year-over-year increase
- Housing Construction Index: 146.3 (+4.5% YoY) — the only region above its pre-pandemic average, running 15.5% above its 2018–19 baseline
- Housing Sales Index: 125.2 (+11.9% YoY) — the strongest regional sales rebound in the country and the only region above its pre-pandemic level
The Midwest: Elevated Stress, Weak Activity
The Midwest presents a different kind of stress. Where the South is seeing the sharpest rate of increase in foreclosure pressure, the Midwest carries the highest absolute foreclosure reading of any region — a distinction that reflects years of cumulative pressure rather than a single cycle's correction.
"The Midwest foreclosure number isn't a spike, it's a grind," Layton said. "The absolute level is the highest of any region in the country, and it's been climbing steadily. Construction never recovered from its pandemic-era peak the way other regions did, and sales remain well below pre-pandemic baselines. There's no single shock driving this — it's the cumulative weight of three years of elevated costs with no supply response and no demand rebound."
The April data across all three indices:
- Foreclosure Index: 55.4 (+11.2% YoY) — the highest absolute foreclosure reading of any U.S. region
- Housing Construction Index: 96.7 (+0.3% YoY) — effectively flat year over year and down 36% from its October 2020 peak, the largest pandemic-era decline of any region
- Housing Sales Index: 83.5 (+3.1% YoY) — modest year-over-year improvement, still 13.8% below the 2018–19 pre-pandemic baseline
The Northeast: Slowest Market, Foreclosure Pressure Easing
The Northeast is the most frozen regional housing market in the country — and the one anomaly in the national foreclosure story. It is the only region where foreclosure pressure is easing year over year, even as construction and sales activity remain the lowest of any region.
"The Northeast foreclosure number is the one genuinely encouraging regional signal in this report," Layton said. "But it's important to read it in context. Foreclosure pressure is declining there, but construction and sales are also the lowest in the country by a wide margin. This isn't a healthy market — it's a locked market. Homeowners aren't losing homes at an accelerating rate, but they're not moving either."
The April data across all three indices:
- Foreclosure Index: 52.5 (–10.4% YoY) — the only U.S. region where foreclosure pressure is declining year over year
- Housing Construction Index: 75.9 (+7.4% YoY) — the lowest construction reading in the country despite the year-over-year gain
- Housing Sales Index: 59.5 (+6.3% YoY) — still 27.1% below February 2020, the most frozen regional sales market in the country
National Picture: Signs point to continued foreclosure squeeze
The national Foreclosure Index reached 49.7 in April 2026, up 13.5% year over year and 71.4% above its April 2021 moratorium-era trough. It is the second consecutive month at the highest sustained level since spring 2020.
"What we flagged in April as an emerging foreclosure trend has now sharpened into a regional story," Layton said. "The direction we predicted is unmistakable. This is nowhere near a 2008-style crisis — the Great Recession peak was 283.2 in March 2009, and we're at 49.7 — but foreclosure pressure is now in its second consecutive year of double-digit gains, and the South is bearing the heaviest load."
The construction and sales pictures are consistent with what April's data suggested. The Housing Construction Index registered 110.0 — down 1.4% year over year and holding in the same narrow 108–118 band it has occupied since mid-2023, with every reading in the past twelve months below the pre-pandemic average. The Housing Sales Index posted its first year-over-year gain in twelve months, ticking up 1.3% to 94.2 — a tentative signal of recovery, but still 11.3% below its February 2020 pre-pandemic level.
The Outlook
The April 2026 readings point to three things heading into summer: foreclosure filings will continue to climb through summer 2026, particularly in southern markets; housing starts will remain near or just below pre-pandemic norms; and existing-home sales activity will likely show modest year-over-year improvement in the coming months.
View the full report here.
About the LegalShield Consumer Stress Legal Index
The LegalShield Consumer Stress Legal Index (CSLI) is a proprietary data set based on more than 150,000 monthly legal intakes from LegalShield members. Historically, the CSLI has served as a leading indicator of macroeconomic trends, often predicting shifts in consumer confidence and financial health weeks or months before official government reports. Released quarterly, view past reports on the CSLI page on LegalShield.com.
About LegalShield
For more than 50 years, LegalShield has provided everyday Americans with easy and affordable access to legal advice, counsel, protection, and representation. Serving millions, LegalShield is one of the world's largest platforms for legal, identity, and reputation management services protecting individuals and businesses across North America. Founded in 1972, LegalShield and its privacy management product IDShield equip individuals, families, businesses, and employers with the tools they need to affordably live a just and secure life. Through technology and innovation, LegalShield is transforming how people access legal guidance, with hundreds of qualified attorneys and law firms across the country. To learn more, visit LegalShield.com and IDShield.com.
Contacts
Media Contact:
Cameron Penn, Director of Communications
CameronPenn@pplsi.com