WaterBridge Announces Fourth Quarter and Fiscal Year 2025 Results
WaterBridge Announces Fourth Quarter and Fiscal Year 2025 Results
Reports fourth quarter 2025 produced water handling volumes of 2.6 million barrels per day and revenue of $208.9 million, representing quarterly growth of 1% and 2%, respectively
Reports full year 2025 combined produced water handling and pro forma revenue growth of 15% and 19%, respectively, year-over-year
Achieved a single-day volume record of approximately 2.9 million barrels per day of produced water handling volumes in fourth quarter 2025
Announced an open season for the second phase of the Speedway long-haul produced water pipeline project in February 2026
HOUSTON--(BUSINESS WIRE)--WaterBridge Infrastructure LLC (NYSE: WBI) (the “Company” or “WaterBridge”) today announced its financial and operating results for the fourth quarter and fiscal year ended December 31, 2025.
Prior to the closing of WaterBridge's initial public offering (the "IPO") on September 18, 2025, WaterBridge completed the successful combination (the "Combination") of its legacy entities WaterBridge Equity Finance LLC ("WBEF"), WaterBridge NDB Operating LLC ("NDB Operating") and Desert Environmental LLC ("Desert Environmental"). Key operational metrics in this release for full year 2025 and all quarters prior to fourth quarter 2025 are presented on a combined basis, and financial results reported in this release for full year 2025 and all quarters prior to fourth quarter 2025 are presented on a pro forma basis in accordance with Article 11 of Regulation S-X, assuming the Combination and the IPO had occurred on January 1, 2024.
Fourth Quarter 2025 Financial Highlights
- Produced water handling volumes of 2.6 million barrels per day, up 1% compared to third quarter combined produced water handling volumes
- Revenue of $208.9 million, up 2% compared to third quarter pro forma revenue
- Net loss of $13.6 million, with net loss margin of 7%
- Adjusted EBITDA of $103.8 million, with Adjusted EBITDA Margin of 50%(1)
- Gross margin of $46.8 million
- Adjusted Operating Margin of $108.9 million(1)
Fiscal Year 2025 Financial Highlights
- Combined produced water handling volumes of 2.4 million barrels per day, up 15% year-over-year
- Pro forma revenue of $790.0 million, up 19% year-over-year
- Pro forma net loss of $58.1 million, with pro forma net loss margin of 7%
- Pro forma Adjusted EBITDA of $402.8 million, with pro forma Adjusted EBITDA Margin of 51%(1)
- Pro forma gross margin of $209.1 million
- Pro forma Adjusted Operating Margin of $416.9 million(1)
Recent Milestones
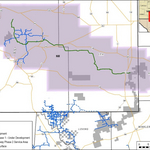
- Continued development of our large-diameter gathering and transportation Speedway Pipeline project (the "Speedway Pipeline"), with an open season for Phase II of the project commencing in February 2026. Phase II is expected to provide up to 500,000 barrels per day (bpd) of throughput capacity, in addition to the 500,000 bpd of throughput capacity for the initial phase of the Speedway Pipeline, for customers in Eddy and Lea counties, New Mexico, increasing access to low pressure pore space on LandBridge (NYSE: LB) surface acreage in the Central Basin Platform.
- Announced inaugural quarterly cash dividend of $0.05 per share in the first quarter of 2026
- Provided full year 2026 Adjusted EBITDA guidance of $420 to $460 million, with year-over-year anticipated growth driven by large scale, minimum volume commitment-backed capital projects
- Realized 99.7% operational uptime with measurement variance of less than 1% across our system for full year 2025, demonstrating the benefits of WaterBridge's optimized, advanced, and technology-driven operations
- Achieved a single-day volume record of approximately 2.9 million barrels per day of produced water handling in fourth quarter of 2025
Management Commentary
Jason Long, Chief Executive Officer of WaterBridge, stated, “2025 was a milestone year for WaterBridge as we brought the largest integrated pure-play water infrastructure network in the United States to the public markets via an upsized IPO. During our first full quarter as a publicly traded company, we achieved record revenues and strong Adjusted EBITDA margins. Featuring predictable cash flows and the Delaware Basin’s most expansive integrated pure-play network of produced water facilities, WaterBridge is uniquely positioned to serve the expanding water takeaway needs of producers. As we enter 2026, we remain dedicated to enabling critical flow assurance through our responsibly developed pore space and recycling infrastructure."
Scott McNeely, Chief Financial Officer of WaterBridge, stated, "WaterBridge entered 2026 from a position of strength and with robust demand for large-scale, high return growth projects. In the year to come, we anticipate further accelerating commercial momentum with the ramp of our bpx Kraken project, the anticipated completion of phase 1 of the Speedway Pipeline project, and strong demand for phase 2 of Speedway. Underpinned by long-term, fixed-fee contracts, a diversified customer base and strong demand for produced water handling, we are building a superb foundation for sustained growth and shareholder value creation."
Fourth Quarter Operational Results
Produced water handling volumes for the fourth quarter were 2.6 million barrels per day, representing a 1% increase compared to the combined produced water handling volumes in the third quarter of 2025. Volume growth was driven by increased produced water handling demand in our Eddy County and Stateline systems, as well as increased produced water volumes due to the continued ramp of the bpx Kraken pipeline project.
Fourth quarter capital expenditures were $89.2 million, primarily driven by construction costs for the first phase of the Speedway Pipeline project, as well as the continued expansion of our Stateline systems in response to growing demand for produced water handling services.
Gross margin and gross margin per barrel for the quarter were $46.8 million and $0.18, respectively, as compared to third quarter 2025 pro forma gross margin and pro forma gross margin per barrel of $58.3 million and $0.22, respectively. Adjusted Operating Margin and Adjusted Operating Margin per barrel were $108.9 million and $0.41 per barrel, respectively, as compared to third quarter 2025 pro forma Adjusted Operating Margin and pro forma Adjusted Operating Margin per Barrel of $111.0 million and $0.42, respectively.(1)
Fourth Quarter Financial Results
Total revenue for the fourth quarter of 2025 was $208.9 million as compared to $205.5 million of total pro forma revenue in the third quarter of 2025. The quarterly increase was mainly driven by continued produced water volume growth across our infrastructure.
Net loss for the fourth quarter of 2025 was $13.6 million as compared to an $18.7 million pro forma net loss in the third quarter of 2025. Adjusted EBITDA was $103.8 million in the fourth quarter of 2025 as compared to pro forma Adjusted EBITDA of $105.7 million in the third quarter of 2025.(1)
Net loss margin was 7% in the fourth quarter of 2025, and Adjusted EBITDA Margin was 50% in the fourth quarter of 2025.(1)
Strong Balance Sheet with Ample Liquidity
Total liquidity was $526.5 million as of December 31, 2025, including approximately $475.0 million of available borrowing capacity under its revolving credit facility and total cash and cash equivalents of $51.5 million. The Company had $1.465 billion of borrowings outstanding as of December 31, 2025, versus $609.4 million of borrowings outstanding as of December 31, 2024.
Return of Capital Initiated
On February 25th, 2026, WaterBridge announced that our Board of Directors declared an inaugural dividend on our Class A shares of $0.05 per share, payable on March 19, 2026 to shareholders of record as of March 5, 2026, and a corresponding required cash distribution to WBI Operating LLC unitholders.
2026 Outlook
WaterBridge's 2026 plan reflects its continued commitment to responsible growth, allocating capital to high-return, minimum volume commitment-driven organic growth projects. Based on current expectations of activity levels and our contract portfolio, the Company expects its full year produced water handling volumes to average approximately 2,500 to 2,700 MBbl/d, representing approximately 7% annual volume growth.
2026 capital expenditures are expected to be approximately $430 to $490 million, primarily driven by growth capital expenditures associated with the Speedway Pipeline project's first and second phases, additional commercial projects schedule for construction in the second half of 2026, and late year construction capital associated with the previously announced 10-year commercial agreement with Devon Energy that includes a 7.5-year MVC, commencing on April 1, 2027, for the transportation and handling of Devon produced water volumes generated in Eddy and Lea counties, New Mexico.
"Based on the high demand and positive customer reception to the first phase of the Speedway Pipeline project, WaterBridge is looking forward to developing incremental projects associated with the second phase of the project as early as the second half of 2026. As always, we will continue to prioritize capital allocation to high-return, organic growth projects to support our customers and their produced water takeaway needs in Eddy and Lea counties," said Jason Long, CEO.
WaterBridge anticipates delivering full year 2026 Adjusted EBITDA of $420 to $460 million, representing approximately 9% annual growth, driven by incremental volume increases from its bpx Kraken project and the first phase of the Speedway Pipeline, which is anticipated to come online mid-year 2026.
(1) Adjusted EBITDA, pro forma Adjusted EBITDA, Adjusted EBITDA Margin, pro forma Adjusted EBITDA Margin, Adjusted Operating Margin, pro forma Adjusted Operating Margin, Adjusted Operating Margin per barrel and pro forma Adjusted Operating Margin per barrel are non-GAAP financial measures. See “Comparison of Non-GAAP Financial Measures” included within the Appendix of this press release for related disclosures and reconciliations to the most directly comparable financial measures calculated and presented in accordance with GAAP. |
Annual Report on Form 10-K
Our financial statements and related footnotes are available in our Annual Report on Form 10-K for the year ended December 31, 2025, which is expected to be filed with the U.S. Securities and Exchange Commission (“SEC”) on March 13, 2026.
Conference Call and Webcast Information
The Company will hold a conference call on Monday, March 16, 2026, at 11:00 a.m. Central Time to discuss fourth quarter and full year 2025 results. A live webcast of the conference call will be available on the Events and Presentations section of the WaterBridge Investor Relations website at https://wbinfra.com/investor-relations/events-and-presentations. To listen to the live broadcast, go to the site at least 10-15 minutes prior to the scheduled start time to register and install any necessary audio software.
To access the live conference call, participants must pre-register online at https://events.q4inc.com/analyst/274147536?pwd=zIN0rN88 to receive unique dial-in information. Pre-registration may be completed at any time up to the call start time. An audio replay will be available following the conclusion of the call and can be accessed via the same link.
About WaterBridge
WaterBridge is a leading integrated, pure-play water infrastructure company with operations predominantly in the Delaware Basin, the most prolific oil and natural gas basin in North America, with additional assets in the Eagle Ford and Arkoma Basins. WaterBridge operates the largest produced water infrastructure network in the United States, through which it provides water management solutions to oil and natural gas exploration and production companies under long-term contracts, which include gathering, transporting, recycling and handling produced water. Headquartered in Houston, Texas, WaterBridge is a first mover in the water midstream sector and benefits from an experienced and entrepreneurial management team. Learn more at www.wbinfra.com
Cautionary Statement Regarding Forward-Looking Statements
This news release may contain forward-looking statements that are based on WaterBridge’s beliefs, as well as assumptions made by, and information currently available to, WaterBridge, and therefore involve risks and uncertainties that are difficult to predict. Generally, future or conditional verbs such as “will,” “would,” “should,” or “could,” and the words “believe,” “anticipate,” “continue,” “intend,” “expect” and similar expressions identify forward-looking statements. Forward-looking statements include, but are not limited to, strategies, plans, objectives, expectations, intentions, assumptions, future operations and prospects and other statements that are not historical facts, including our estimated future financial performance. You should not place undue reliance on forward-looking statements. Although WaterBridge believes that plans, intentions and expectations reflected in or suggested by any forward-looking statements made herein are reasonable, WaterBridge may be unable to achieve such plans, intentions or expectations and actual results, and performance or achievements may vary materially and adversely from those envisaged in this news release due to a number of factors including, but not limited to: our customers’ demand for and use of our services; the domestic and foreign supply of, and demand for, energy sources, including the impact of actions relating to oil price and production controls by OPEC+ with respect to oil production levels and announcements of potential changes to such levels; our reliance on a limited number of customers, as well as our operations in the Delaware Basin, for a substantial majority of our revenues; our ability to enter into favorable contracts with our customers, including the prices we are able to charge and the margins we are able to realize; commodity price volatility and trends related to changes in commodity prices, and our customers’ ability to successfully navigate through such volatility; the availability of additional pore space for future capacity expansion; the level of competition from other water management companies; changes in the prices charged to our customers and availability of services necessary for our customers to conduct their businesses, as a result of oversupply, government regulations or other factors; any planned or future expansion projects by us or our customers; our ability to pay dividends; the development of advances or changes in energy technologies or practices; our ability to successfully implement our growth plans, including through organic growth projects, future acquisitions or otherwise; the potential deterioration of our customers’ financial condition and their ability to access capital to fund their development programs; the degree to which consolidation among our customers may affect spending on U.S. drilling and completions in the near term; our and our customers’ ability to obtain necessary supplies, raw materials and other critical components on a timely basis, or at all; our and our customers’ ability to obtain government approvals or acquire or maintain necessary permits, including those related to the development and operation of produced water handling facilities; operational disruptions and liability related thereto associated with our customers, including those due to environmental hazards, fires, explosions, chemical mishandling or other industrial accidents; our liquidity and our ability to access the capital markets on favorable terms, or at all, which depends on general market conditions, including the impact of inflation, elevated tariffs, interest rates and related governmental policies and potential economic recession; the effects of geopolitical conflicts, domestic political uncertainties or armed conflict in oil and natural gas producing regions, including increased hostilities in the Middle East, including Iran, which may decrease demand for oil and natural gas or contribute to volatility in the prices for oil and natural gas, which could decrease demand for our services; our level of indebtedness and our ability to service our indebtedness; our ability to integrate future acquisitions and manage related growth; our ability to recruit and retain key management and employees; actions taken by the federal or state governments, such as executive orders or new or expanded regulations, that may impact future energy production in the U.S. and any acceleration of the domestic and/or international transition to a low carbon economy; changes in laws and regulations (or the interpretation thereof), including those related to hydraulic fracturing, accessing water, disposing of wastewater, transferring produced water, interstate brackish water transfer, carbon pricing, pipeline construction, data piracy, taxation or emissions, leasing, permitting or drilling and various other environmental matters, in particular, those intended to address seismic activity or over-pressurization; changes in effective tax rates, or adverse outcomes resulting from other tax increases or an examination of our income or other tax returns and tax inefficiencies; the severity and duration of world health events, natural disasters or inclement or hazardous weather conditions, including cold weather, hurricanes, fires, droughts, earthquakes, flooding and tornadoes; evolving cybersecurity risks, such as those involving unauthorized access, third-party provider defects and service failures; denial-of-service attacks, malicious software, data privacy breaches by employees or other service providers, insider or others with authorized access, cyber or phishing attacks, ransomware, social engineering, physical breaches or other action. These risks, as well as other risks associated with WaterBridge, are also more fully discussed in WaterBridge’s filings with the SEC, including its most recent Annual Report on Form 10-K and any subsequently filed Quarterly Reports on Form 10-Q and Current Reports on Form 8-K. You can access WaterBridge’s filings with the SEC through the SEC's website at http://www.sec.gov. Except as required by applicable law, WaterBridge undertakes no obligation to update any forward-looking statements or other statements herein for revisions or changes after this communication is made.
FOURTH QUARTER AND FULL YEAR 2025 RESULTS
WATERBRIDGE INFRASTRUCTURE LLC CONSOLIDATED STATEMENTS OF OPERATIONS
(in thousands) (unaudited)
|
|
Three Months
|
|
|
Three Months
|
|
|
Nine Months
|
|
|||
Revenues: |
|
|
|
|
|
|
|
|
|
|||
Produced water handling |
|
$ |
155,475 |
|
|
$ |
157,306 |
|
|
$ |
431,649 |
|
Produced water handling - related party |
|
|
30,555 |
|
|
|
27,573 |
|
|
|
83,546 |
|
Water solutions |
|
|
10,563 |
|
|
|
11,151 |
|
|
|
32,841 |
|
Water solutions - related party |
|
|
1,502 |
|
|
|
573 |
|
|
|
3,874 |
|
Other revenues |
|
|
9,131 |
|
|
|
8,651 |
|
|
|
28,906 |
|
Other revenues - related party |
|
|
1,655 |
|
|
|
214 |
|
|
|
261 |
|
Total revenues |
|
|
208,881 |
|
|
|
205,468 |
|
|
|
581,077 |
|
|
|
|
|
|
|
|
|
|
|
|||
Direct operating costs |
|
|
79,007 |
|
|
|
76,707 |
|
|
|
214,625 |
|
Direct operating costs - related party |
|
|
14,357 |
|
|
|
12,475 |
|
|
|
33,718 |
|
Depreciation, depletion, amortization, and accretion |
|
|
68,687 |
|
|
|
73,523 |
|
|
|
202,624 |
|
Total cost of revenues |
|
|
162,051 |
|
|
|
162,705 |
|
|
|
450,967 |
|
|
|
|
|
|
|
|
|
|
|
|||
General and administrative expense |
|
|
24,058 |
|
|
|
17,411 |
|
|
|
47,786 |
|
Loss on disposal of assets, net |
|
|
148 |
|
|
|
141 |
|
|
|
11,832 |
|
Other operating expense, net |
|
|
341 |
|
|
|
5,528 |
|
|
|
8,821 |
|
Operating income |
|
|
22,283 |
|
|
|
19,683 |
|
|
|
61,671 |
|
|
|
|
|
|
|
|
|
|
|
|||
Interest expense, net |
|
|
25,380 |
|
|
|
41,039 |
|
|
|
113,089 |
|
Loss on extinguishment of debt, net |
|
|
11,411 |
|
|
|
- |
|
|
|
- |
|
Other income, net |
|
|
(137 |
) |
|
|
(915 |
) |
|
|
(2,717 |
) |
Loss from operations before taxes |
|
|
(14,371 |
) |
|
|
(20,441 |
) |
|
|
(48,701 |
) |
|
|
|
|
|
|
|
|
|
|
|||
Income tax benefit |
|
|
(788 |
) |
|
|
(1,758 |
) |
|
|
(4,188 |
) |
Net loss |
|
$ |
(13,583 |
) |
|
$ |
(18,683 |
) |
|
$ |
(44,513 |
) |
Net income prior to IPO |
|
|
- |
|
|
|
|
|
|
|
||
Net loss attributable to noncontrolling interest |
|
|
(9,713 |
) |
|
|
|
|
|
|
||
Net loss attributable to WaterBridge Infrastructure LLC |
|
$ |
(3,870 |
) |
|
|
|
|
|
|
||
(1) |
Statement of operations for the three months and nine months ended September 30, 2025 are presented on a pro forma basis. |
PRO FORMA COMBINED STATEMENTS OF OPERATIONS FOR THE YEAR ENDED DECEMBER 31, 2025
(in thousands) (unaudited)
|
|
Reported
|
|
|
Historical
|
|
|
Historical
|
|
|
Transaction
|
|
|
Transaction
|
|
|
Pro Forma
|
|
||||||
Revenues: |
|
|
|
|
|
|
|
|
|
|
|
|
|
|
|
|
|
|
||||||
Produced water handling |
|
$ |
357,043 |
|
|
$ |
229,038 |
|
|
$ |
- |
|
|
$ |
1,043 |
|
(a) |
$ |
- |
|
|
$ |
587,124 |
|
Produced water handling - related party |
|
|
114,583 |
|
|
|
315 |
|
|
|
- |
|
|
|
(797 |
) |
(b) |
|
- |
|
|
|
114,101 |
|
Water solutions |
|
|
35,077 |
|
|
|
8,327 |
|
|
|
- |
|
|
|
- |
|
|
|
- |
|
|
|
43,404 |
|
Water solutions - related party |
|
|
5,376 |
|
|
|
- |
|
|
|
- |
|
|
|
- |
|
|
|
- |
|
|
|
5,376 |
|
Other revenues |
|
|
11,567 |
|
|
|
4,954 |
|
|
|
21,516 |
|
|
|
- |
|
|
|
- |
|
|
|
38,037 |
|
Other revenues - related party |
|
|
1,907 |
|
|
|
- |
|
|
|
6,549 |
|
|
|
(6,540 |
) |
(b) |
|
- |
|
|
|
1,916 |
|
Total revenues |
|
|
525,553 |
|
|
|
242,634 |
|
|
|
28,065 |
|
|
|
(6,294 |
) |
|
|
- |
|
|
|
789,958 |
|
|
|
|
|
|
|
|
|
|
|
|
|
|
|
|
|
|
|
|
||||||
Direct operating costs |
|
|
194,394 |
|
|
|
88,529 |
|
|
|
10,342 |
|
|
|
- |
|
|
|
367 |
|
(c) |
|
293,632 |
|
Direct operating costs - related party |
|
|
48,019 |
|
|
|
4,256 |
|
|
|
2,413 |
|
|
|
(6,613 |
) |
(b) |
|
- |
|
|
|
48,075 |
|
Depreciation, depletion, amortization, and accretion |
|
|
140,899 |
|
|
|
82,974 |
|
|
|
4,442 |
|
|
|
42,996 |
|
(a) |
|
- |
|
|
|
271,311 |
|
Total cost of revenues |
|
|
383,312 |
|
|
|
175,759 |
|
|
|
17,197 |
|
|
|
36,383 |
|
|
|
367 |
|
|
|
613,018 |
|
|
|
|
|
|
|
|
|
|
|
|
|
|
|
|
|
|
|
|
||||||
General and administrative expense |
|
|
47,237 |
|
|
|
1,678 |
|
|
|
3,152 |
|
|
|
- |
|
|
|
19,777 |
|
(c) |
|
71,844 |
|
Loss on sale of assets, net |
|
|
11,980 |
|
|
|
- |
|
|
|
- |
|
|
|
- |
|
|
|
- |
|
|
|
11,980 |
|
Other operating expense, net |
|
|
4,162 |
|
|
|
4,810 |
|
|
|
190 |
|
|
|
- |
|
|
|
- |
|
|
|
9,162 |
|
Operating income |
|
|
78,862 |
|
|
|
60,387 |
|
|
|
7,526 |
|
|
|
(42,677 |
) |
|
|
(20,144 |
) |
|
|
83,954 |
|
|
|
|
|
|
|
|
|
|
|
|
|
|
|
|
|
|
|
|
||||||
Interest expense, net |
|
|
68,940 |
|
|
|
79,710 |
|
|
|
735 |
|
|
|
(6,599 |
) |
(d) |
|
(4,317 |
) |
(d) |
|
138,469 |
|
Loss on extinguishment of debt, net |
|
|
11,411 |
|
|
|
- |
|
|
|
- |
|
|
|
- |
|
|
|
- |
|
|
|
11,411 |
|
Other income, net |
|
|
(433 |
) |
|
|
(2,421 |
) |
|
|
- |
|
|
|
- |
|
|
|
- |
|
|
|
(2,854 |
) |
(Loss) income from operations before taxes |
|
|
(1,056 |
) |
|
|
(16,902 |
) |
|
|
6,791 |
|
|
|
(36,078 |
) |
|
|
(15,827 |
) |
|
|
(63,072 |
) |
|
|
|
|
|
|
|
|
|
|
|
|
|
|
|
|
|
|
|
||||||
Income tax (benefit) expense |
|
|
(1,065 |
) |
|
|
(40 |
) |
|
|
104 |
|
|
|
- |
|
|
|
(3,975 |
) |
(e) |
|
(4,976 |
) |
Net income (loss) |
|
$ |
9 |
|
|
$ |
(16,862 |
) |
|
$ |
6,687 |
|
|
$ |
(36,078 |
) |
|
$ |
(11,852 |
) |
|
$ |
(58,096 |
) |
Summary of Pro Forma Adjustments
Pro forma adjustments included in the Unaudited Pro Forma Combined Statements of Operations for the year ended December 31, 2025 are as follows:
(a) |
Reflects changes in depreciation and amortization expense related to fixed assets and intangible assets recognized at fair value upon consummation of the WaterBridge Combination, as well as changes in amortization associated with up-front payments related to contract dedications that were previously amortized as a reduction of service revenue. |
|||
|
|
|||
(b) |
Reflects the elimination of related party revenues and direct operating costs between Desert Environmental and each of WaterBridge and WBEF prior to the WaterBridge Combination. |
|||
|
|
|||
(c) |
Reflects a reduction in share-based compensation expense associated with the remeasurement of incentive units classified as liability awards previously allocated to WBEF. The adjustment assumed that the incentive units were either cancelled or converted into common equity of the issuing entity as of January 1, 2024. The reduction in share-based compensation expense related to such incentive units is offset by the recognition of restricted share unit (“RSU”) expense associated with initial IPO grants, based on the assumption that the Company’s RSUs were granted on January 1, 2024. The RSU expense has been calculated by recognizing the grant-date fair value of the RSUs on the date of issuance and amortized over a three-year vesting period. |
|||
|
|
|||
(d) |
Reflects the elimination of Desert Environmental and WBEF’s debt issuance cost amortization associated with their respective credit facilities as a result of the WaterBridge Combination. In addition, this reflects the reduction of interest expense associated with the pay down of the NDB Revolving Credit Facility, SDB Revolving Credit Facility and the Desert Environmental Term Loan with net proceeds from the IPO. |
|||
|
|
|||
(e) |
Reflects estimated incremental income tax expense associated with the Company’s results of operations assuming the Company’s earnings had been subject to federal income tax as a subchapter C Corporation using a statutory tax rate of approximately 8.6%. This rate is inclusive of U.S. federal and state income taxes. |
WATERBRIDGE INFRASTRUCTURE LLC AND SUBSIDIARIES CONSOLIDATED BALANCE SHEETS
(in thousands)
|
|
December 31, |
|
|||||
|
|
2025 |
|
|
2024 |
|
||
Current assets: |
|
|
|
|
|
|
||
Cash and cash equivalents |
|
$ |
51,543 |
|
|
$ |
13,284 |
|
Accounts receivable, net |
|
|
161,645 |
|
|
|
49,472 |
|
Other receivables |
|
|
2,634 |
|
|
|
1,549 |
|
Related party accounts receivable |
|
|
30,469 |
|
|
|
50,025 |
|
Prepaid expenses and other current assets |
|
|
14,834 |
|
|
|
6,008 |
|
Total current assets |
|
|
261,125 |
|
|
|
120,338 |
|
|
|
|
|
|
|
|
||
Non-current assets: |
|
|
|
|
|
|
||
Property, plant and equipment, net |
|
|
2,285,536 |
|
|
|
1,101,041 |
|
Goodwill |
|
|
53,127 |
|
|
|
9,091 |
|
Intangible assets, net |
|
|
935,708 |
|
|
|
98,589 |
|
Deferred tax assets |
|
|
131,805 |
|
|
|
- |
|
Other assets |
|
|
32,719 |
|
|
|
21,528 |
|
Total non-current assets |
|
|
3,438,895 |
|
|
|
1,230,249 |
|
Total assets |
|
$ |
3,700,020 |
|
|
$ |
1,350,587 |
|
|
|
|
|
|
|
|
||
Liabilities and equity |
|
|
|
|
|
|
||
Current liabilities: |
|
|
|
|
|
|
||
Accounts payable |
|
$ |
38,732 |
|
|
$ |
16,899 |
|
Related party accounts payable |
|
|
5,851 |
|
|
|
13,721 |
|
Accrued liabilities |
|
|
130,126 |
|
|
|
44,553 |
|
Current portion of long-term debt |
|
|
12,546 |
|
|
|
6,536 |
|
Other current liabilities |
|
|
1,685 |
|
|
|
1,759 |
|
Total current liabilities |
|
|
188,940 |
|
|
|
83,468 |
|
|
|
|
|
|
|
|
||
Non-current liabilities: |
|
|
|
|
|
|
||
Long-term debt, net of debt issuance costs |
|
|
1,431,837 |
|
|
|
586,417 |
|
Tax receivable agreement liability |
|
|
201,375 |
|
|
|
- |
|
Other long-term liabilities |
|
|
30,259 |
|
|
|
17,653 |
|
Total non-current liabilities |
|
|
1,663,471 |
|
|
|
604,070 |
|
Total liabilities |
|
|
1,852,411 |
|
|
|
687,538 |
|
|
|
|
|
|
|
|
||
Commitments and contingencies |
|
|
|
|
|
|
||
|
|
|
|
|
|
|
||
Member’s equity |
|
|
- |
|
|
|
663,049 |
|
Class A shares, unlimited shares authorized and 43,264,850 shares issued and outstanding as of December 31, 2025. None authorized, issued or outstanding as of December 31, 2024. |
|
|
606,843 |
|
|
|
- |
|
Class B shares, unlimited shares authorized and 80,190,150 shares issued and outstanding as of December 31, 2025. None authorized, issued or outstanding as of December 31, 2024. |
|
|
- |
|
|
|
- |
|
Retained earnings |
|
|
(4,537 |
) |
|
|
- |
|
Total shareholders’ equity attributable to WaterBridge Infrastructure LLC |
|
|
602,306 |
|
|
|
- |
|
Noncontrolling interest |
|
|
1,245,303 |
|
|
|
- |
|
Total shareholders’ and member’s equity |
|
|
1,847,609 |
|
|
|
663,049 |
|
Total liabilities and equity |
|
$ |
3,700,020 |
|
|
$ |
1,350,587 |
|
WATERBRIDGE INFRASTRUCTURE LLC AND SUBSIDIARIES CONSOLIDATED STATEMENTS OF CASH FLOWS
(in thousands)
|
|
Year Ended December 31, |
|
|||||
|
|
2025 |
|
|
2024 |
|
||
Cash flows from operating activities |
|
|
|
|
|
|
||
Net income |
|
$ |
9 |
|
|
$ |
2,992 |
|
Adjustments to reconcile net income to net cash provided by operating activities: |
|
|
|
|
|
|
||
Depreciation, depletion, amortization, and accretion |
|
|
140,899 |
|
|
|
78,315 |
|
Amortization and write off of debt issuance costs |
|
|
4,359 |
|
|
|
5,303 |
|
Share-based compensation |
|
|
5,338 |
|
|
|
9,529 |
|
Contractual customer relationships amortization |
|
|
1,832 |
|
|
|
1,749 |
|
Loss (gain) on disposal of assets, net |
|
|
11,980 |
|
|
|
(137 |
) |
Loss on extinguishment of debt, net |
|
|
11,411 |
|
|
|
- |
|
Deferred income tax benefit |
|
|
(1,246 |
) |
|
|
- |
|
Other |
|
|
505 |
|
|
|
1,314 |
|
Changes in operating assets and liabilities: |
|
|
|
|
|
|
||
Accounts receivable |
|
|
(37,051 |
) |
|
|
(4,928 |
) |
Related party accounts receivable |
|
|
14,455 |
|
|
|
(22,388 |
) |
Prepaid expenses and other assets |
|
|
(1,002 |
) |
|
|
(337 |
) |
Accounts payable |
|
|
5,089 |
|
|
|
(37 |
) |
Related party accounts payable |
|
|
3,721 |
|
|
|
5,719 |
|
Contract liabilities |
|
|
(120 |
) |
|
|
(37 |
) |
Accrued and other liabilities |
|
|
(484 |
) |
|
|
(148 |
) |
Consideration paid to customer |
|
|
- |
|
|
|
(3,050 |
) |
Net cash provided by operating activities |
|
|
159,695 |
|
|
|
73,859 |
|
|
|
|
|
|
|
|
||
Cash flows from investing activities |
|
|
|
|
|
|
||
Acquisitions, net of cash acquired |
|
|
39,901 |
|
|
|
(166,523 |
) |
Capital expenditures |
|
|
(278,569 |
) |
|
|
(159,921 |
) |
Proceeds from disposal of assets |
|
|
20,045 |
|
|
|
2,783 |
|
Net cash used in investing activities |
|
|
(218,623 |
) |
|
|
(323,661 |
) |
|
|
|
|
|
|
|
||
Cash flows from financing activities |
|
|
|
|
|
|
||
Repayments of debt |
|
|
(1,849,222 |
) |
|
|
(359,777 |
) |
Proceeds from debt |
|
|
1,505,000 |
|
|
|
630,000 |
|
Proceeds from issuance of Class A shares, net of underwriting discounts and commissions |
|
|
685,354 |
|
|
|
- |
|
Purchase of OpCo equity interests from Elda River |
|
|
(228,162 |
) |
|
|
- |
|
Debt issuance costs |
|
|
(26,460 |
) |
|
|
(18,858 |
) |
Contributions from member |
|
|
20,080 |
|
|
|
- |
|
Offering costs |
|
|
(8,261 |
) |
|
|
- |
|
Repayments of finance leases |
|
|
(1,142 |
) |
|
|
(1,148 |
) |
Net cash provided by financing activities |
|
|
97,187 |
|
|
|
250,217 |
|
Net increase in cash and cash equivalents |
|
|
38,259 |
|
|
|
415 |
|
Cash and cash equivalents - beginning of period |
|
|
13,284 |
|
|
|
12,869 |
|
Cash and cash equivalents - end of period |
|
$ |
51,543 |
|
|
$ |
13,284 |
|
Reconciliation of Non-GAAP and Pro Forma Non-GAAP Financial Measures
Adjusted EBITDA, Adjusted EBITDA Margin, Adjusted Operating Margin, and Adjusted Operating Margin per barrel are supplemental non-GAAP measures that we use to evaluate current, past and expected future performance. Although these non-GAAP financial measures are important factors in assessing our operating results, they should not be considered in isolation or as a substitute for net income, gross margin or any other measures presented under GAAP or Article 11 of Regulation S-X.
Adjusted EBITDA and Adjusted EBITDA Margin are used to assess the financial performance of our assets over the long term. We define Adjusted EBITDA as net income (loss) before interest; taxes; depreciation, amortization, depletion and accretion; share-based compensation; transaction-related expenses; debt modification and extinguishment costs and other non-cash or non-recurring expenses. We define Adjusted EBITDA Margin as Adjusted EBITDA divided by total revenues.
We believe Adjusted EBITDA and Adjusted EBITDA Margin are useful because they allow us to more effectively evaluate our operating performance and compare the results of our operations from period to period, and against our peers, without regard to our financing methods or capital structure. We exclude the items listed above from net income (loss) in arriving at Adjusted EBITDA and Adjusted EBITDA Margin because these amounts can vary substantially from company to company within our industry depending upon accounting methods, book values of assets, capital structures and the method by which the assets were acquired.
The following table sets forth a reconciliation of net income as determined in accordance with Article 11 of Regulation S-K to Adjusted EBITDA and Adjusted EBITDA Margin for the periods indicated.
|
|
Three Months
|
|
|
Three Months
|
|
||
Net loss |
|
$ |
(13,583 |
) |
|
$ |
(18,683 |
) |
Adjustments: |
|
|
|
|
|
|
||
Depreciation, depletion, amortization, and accretion(2) |
|
|
68,997 |
|
|
|
75,510 |
|
Interest expense, net |
|
|
25,380 |
|
|
|
41,039 |
|
Income tax benefit |
|
|
(788 |
) |
|
|
(1,758 |
) |
EBITDA |
|
$ |
80,006 |
|
|
$ |
96,108 |
|
Adjustments: |
|
|
|
|
|
|
||
Transaction related-expenses(3) |
|
|
9,133 |
|
|
|
4,552 |
|
Share-based compensation - NDB Incentive Units |
|
|
1,008 |
|
|
|
(21,432 |
) |
Share-based compensation – RSUs |
|
|
1,737 |
|
|
|
24,243 |
|
Temporary power costs |
|
|
273 |
|
|
|
580 |
|
Loss on disposal of assets, net |
|
|
148 |
|
|
|
377 |
|
Sales tax liability release(4) |
|
|
(237 |
) |
|
|
- |
|
Debt modification and extinguishment costs |
|
|
11,545 |
|
|
|
258 |
|
Other(5) |
|
|
227 |
|
|
|
1,002 |
|
Adjusted EBITDA |
|
$ |
103,840 |
|
|
$ |
105,688 |
|
|
|
|
|
|
|
|
||
Total revenues |
|
|
208,881 |
|
|
|
205,468 |
|
Net loss margin |
|
|
(7 |
)% |
|
|
(9 |
)% |
Adjusted EBITDA Margin |
|
|
50 |
% |
|
|
51 |
% |
(1) |
Revenue, net loss, net loss margin, Adjusted EBITDA and Adjusted EBITDA Margin for the three months ended September 30, 2025 are presented on a pro forma basis. |
|
(2) |
Includes the amortization expense associated with the Company’s contractual customer relationships as reported in produced water handling revenues. |
|
(3) |
Transaction related-expenses consist of non-capitalizable transaction costs associated with corporate reorganization and non-capitalizable IPO-related charges. |
|
(4) |
Sales tax liability release represents the release of a liability associated with transaction taxes recorded in conjunction with a historical acquisition. |
|
(5) |
Other consists of abandoned well costs, abandoned acquisition and project costs, and other non-cash or non-recurring items. |
Adjusted Operating Margin and Adjusted Operating Margin per barrel are dependent upon the volume of produced water the Company gathers and handles, the volume of recycled water and brackish water WaterBridge sells and transfers, the fees WaterBridge charges for such services and the recurring operating expenses WaterBridge incurs to perform such services. The Company defines Adjusted Operating Margin as gross margin plus depreciation, depletion, amortization and accretion excluding other revenues and cost of other revenues not associated with our produced water handling and water solution revenue streams. WaterBridge defines Adjusted Operating Margin per barrel as Adjusted Operating Margin divided by total volumes handled, sold or transferred.
WaterBridge seeks to enhance WaterBridge’s Adjusted Operating Margin in part by reducing, to the extent appropriate, expenses directly tied to operating WaterBridge’s assets. Landowner royalties, power expenses for handling and treatment facilities, direct labor costs, chemical costs, workover expenses and repair and maintenance costs comprise the most significant portion of its expenses. WaterBridge’s operating expenses are largely variable and as such, generally fluctuate in correlation with throughput volumes.
WaterBridge’s Adjusted Operating Margin incrementally benefits from increased water solutions recycled water sales. When produced water is recycled, WaterBridge recognizes cost savings from reduced landowner royalties, reduced pumping costs, lower chemical treatment and filtration costs and reduced power consumption.
The following table sets forth a reconciliation of gross margin and gross margin per barrel, as determined in accordance with GAAP to Adjusted Operating Margin and Adjusted Operating Margin per barrel for the periods presented for our produced water handling and water solutions revenues.
|
|
Three Months Ended
|
|
|
(Dollars in thousands, except per barrel data) |
|
|
|
|
Total revenues |
|
$ |
208,881 |
|
Cost of revenues |
|
|
(162,051 |
) |
Gross margin |
|
|
46,830 |
|
Less: Other revenues |
|
|
(10,786 |
) |
Less: Cost of other revenues(1) |
|
|
3,906 |
|
Depreciation, depletion, amortization, and accretion(2) |
|
|
68,997 |
|
Adjusted Operating Margin |
|
$ |
108,947 |
|
Total volumes(3) (MBbls) |
|
|
264,995 |
|
Gross margin ($/Bbl) |
|
$ |
0.18 |
|
Adjusted Operating Margin ($/Bbl) |
|
$ |
0.41 |
|
(1) |
Cost of other revenues includes direct operating costs associated with our energy waste management, gas transportation and divested crude transportation services. |
|
(2) |
Includes the amortization expense associated with the Company’s contractual customer relationships as reported in Produced Water Handling revenues. |
|
(3) |
Total volumes excludes skim oil volumes. |
Pro forma Adjusted EBITDA, pro forma Adjusted EBITDA Margin, pro forma Adjusted Operating Margin and pro forma Adjusted Operating Margin per barrel are supplemental non-GAAP measures that we use to evaluate current, past and expected future performance. Although these non-GAAP financial measures are important factors in assessing our operating results, they should not be considered in isolation or as a substitute for net income, gross margin or any other measures presented under GAAP or Article 11 of Regulation S-X.
Pro forma Adjusted EBITDA and pro forma Adjusted EBITDA Margin are used to assess the financial performance of our assets over the long term. We define pro forma Adjusted EBITDA as net income (loss) before interest; taxes; depreciation, depletion, amortization and accretion; share-based compensation; transaction-related expenses; gains or losses on disposal of assets; debt modification and extinguishment costs; and other non-cash or non-recurring expenses, all on a pro forma basis. We define pro forma Adjusted EBITDA Margin as pro forma Adjusted EBITDA divided by pro forma total revenues.
We believe pro forma Adjusted EBITDA and pro forma Adjusted EBITDA Margin are useful because they allow us to more effectively evaluate our operating performance and compare the results of our operations from period to period, and against our peers, without regard to our financing methods or capital structure. We exclude the items listed above from pro forma net income (loss) in arriving at pro forma Adjusted EBITDA and pro forma Adjusted EBITDA Margin because these amounts can vary substantially from company to company within our industry depending upon accounting methods, book values of assets, capital structures and the method by which the assets were acquired.
The following table sets forth a reconciliation of pro forma net income as determined in accordance with Article 11 of Regulation S-K to pro forma Adjusted EBITDA and pro forma Adjusted EBITDA Margin for the periods indicated.
|
|
Year Ended December 31, |
|
|||||
|
|
2025 |
|
|
2024 |
|
||
Pro forma net loss |
|
$ |
(58,096 |
) |
|
$ |
(101,766 |
) |
Adjustments: |
|
|
|
|
|
|
||
Depreciation, depletion, amortization, and accretion(1) |
|
|
273,610 |
|
|
|
268,118 |
|
Interest expense, net |
|
|
138,469 |
|
|
|
160,432 |
|
Income tax benefit |
|
|
(4,976 |
) |
|
|
(6,555 |
) |
Pro forma EBITDA |
|
$ |
349,007 |
|
|
$ |
320,229 |
|
Adjustments: |
|
|
|
|
|
|
||
Share-based compensation - NDB Incentive Units(2) |
|
|
8,417 |
|
|
|
9,529 |
|
Share-based compensation - RSUs(2) |
|
|
1,737 |
|
|
|
5,611 |
|
Temporary power costs |
|
|
1,291 |
|
|
|
1,473 |
|
Loss (gain) on disposal of assets, net |
|
|
12,254 |
|
|
|
(530 |
) |
Debt modification and extinguishment costs |
|
|
11,724 |
|
|
|
2,370 |
|
Transaction related-expenses(3) |
|
|
15,768 |
|
|
|
1,579 |
|
Sales tax liability release(4) |
|
|
(237 |
) |
|
|
(4,841 |
) |
Litigation settlements and expenses(5) |
|
|
- |
|
|
|
7,037 |
|
Asset integration costs |
|
|
- |
|
|
|
3,178 |
|
Other(6) |
|
|
2,835 |
|
|
|
1,466 |
|
Pro forma Adjusted EBITDA |
|
$ |
402,796 |
|
|
$ |
347,101 |
|
|
|
|
|
|
|
|
||
Pro forma combined revenue |
|
$ |
789,958 |
|
|
$ |
662,164 |
|
Pro forma net loss margin |
|
|
(7 |
)% |
|
|
(15 |
)% |
Pro forma Adjusted EBITDA margin |
|
|
51 |
% |
|
|
52 |
% |
(1) |
Includes the amortization expense associated with the Company’s contractual customer relationships as reported in Produced Water Handling revenues. |
|
(2) |
Share-based compensation represents the non-cash charges related to the NDB Incentive Units and the net impact of eliminating WBEF liability-classified incentive unit expense and recognition of RSU expense for IPO grants amortized over a three-year vesting period. |
|
(3) |
Transaction related-expenses consist of non-capitalizable transaction costs associated with corporate reorganization and non-capitalizable IPO-related charges. |
|
(4) |
Sales tax liability release represents the release of a liability associated with transaction taxes recorded in conjunction with a historical acquisition. |
|
(5) |
Litigation settlements and expenses consist of costs incurred not in the ordinary course of business. Routine litigation has not been adjusted |
|
(6) |
Other consists of abandoned well costs, abandoned project costs and non-recurring items. |
Pro Forma Adjusted Operating Margin and pro forma Adjusted Operating Margin per barrel are dependent upon the volume of produced water the Company gathers and handles, the volume of recycled water and brackish water WaterBridge sells and transfers, the fees WaterBridge charges for such services and the recurring operating expenses WaterBridge incurs to perform such services. The Company defines pro forma Adjusted Operating Margin as gross margin plus depreciation, amortization and accretion excluding other revenues not associated with our produced water handling and water solution revenue streams. WaterBridge defines pro forma Adjusted Operating Margin per barrel as pro forma Adjusted Operating Margin divided by combined total volumes handled, sold or transferred.
WaterBridge seeks to enhance WaterBridge’s pro forma Adjusted Operating Margin in part by reducing, to the extent appropriate, expenses directly tied to operating WaterBridge’s assets. Landowner royalties, power expenses for handling and treatment facilities, direct labor costs, chemical costs, workover expenses and repair and maintenance costs comprise the most significant portion of its expenses. WaterBridge’s operating expenses are largely variable and as such, generally fluctuate in correlation with throughput volumes.
WaterBridge’s pro forma Adjusted Operating Margin incrementally benefits from increased water solutions recycled water sales. When produced water is recycled, WaterBridge recognizes cost savings from reduced landowner royalties, reduced pumping costs, lower chemical treatment and filtration costs and reduced power consumption.
The following table sets forth a reconciliation of pro forma gross margin and pro forma gross margin per barrel, as determined in accordance with Article 11, to pro forma Adjusted Operating Margin and pro forma Adjusted Operating Margin per barrel for the periods presented for our produced water handling and water solutions revenues. The amounts presented in the table below represent the combined results of WaterBridge and WBEF.
|
|
Three Months
|
|
|
Nine Months
|
|
|
Year
|
|
|||
(Dollars in thousands, except per barrel data) |
|
|
|
|
|
|
|
|
|
|||
Pro forma produced water handling and water solutions total revenues |
|
$ |
199,549 |
|
|
$ |
559,306 |
|
|
$ |
768,187 |
|
Pro forma produced water handling and water solutions cost of revenues |
|
|
(141,201 |
) |
|
|
(397,020 |
) |
|
|
(559,071 |
) |
Pro forma produced water handling and water solutions gross margin |
|
|
58,348 |
|
|
|
162,286 |
|
|
|
209,116 |
|
Less: Produced water handling and water solutions other revenues |
|
|
(2,993 |
) |
|
|
(7,642 |
) |
|
|
(18,428 |
) |
Pro forma produced water handling and water solutions adjusted gross margin(1) |
|
|
55,355 |
|
|
|
154,644 |
|
|
|
190,688 |
|
Pro forma depreciation, amortization, and accretion(2) |
|
|
55,690 |
|
|
|
157,174 |
|
|
|
226,172 |
|
Pro forma Adjusted Operating Margin |
|
$ |
111,045 |
|
|
$ |
311,818 |
|
|
$ |
416,860 |
|
Combined total volumes(3) (MBbls) |
|
|
261,862 |
|
|
|
752,241 |
|
|
|
1,017,236 |
|
Pro forma gross margin ($/Bbl) |
|
$ |
0.22 |
|
|
$ |
0.22 |
|
|
$ |
0.21 |
|
Pro forma Adjusted Operating Margin ($/Bbl) |
|
$ |
0.42 |
|
|
$ |
0.41 |
|
|
$ |
0.41 |
|
(1) |
Pro forma produced water handling water solutions adjusted gross margin is calculated as pro forma produced water handling and water solutions revenues less pro forma produced water handling and water solutions cost of revenues. | |||||||||
(2) |
Includes the amortization expense associated with the Company’s contractual customer relationships as reported in Produced Water Handling revenues. | |||||||||
(3) |
Combined total volumes include produced water handling and water solutions volumes and exclude skim oil volumes. | |||||||||
(4) |
In connection with the preparation of this earnings release, we identified immaterial errors in the pro forma non-GAAP Adjusted Operating Margin and pro forma non-GAAP Adjusted Operating Margin per Barrel reporting for on November 12, 2025. The error resulted from a formula error in our pro forma non-GAAP calculation workbook. The corrected pro forma non-GAAP Adjusted Operating Margin and pro forma non-GAAP Adjusted Operating Margin per Barrel amounts are presented in the table herein. The corrections had no impact on our previously reported GAAP financial results. The periods impacted are as follows: | |||||||||
|
a. |
Three months ended September 30, 2025: | ||||||||
|
i. |
Pro forma Adjusted Operating Margin: $111,045 (previously reported as $130,865) |
||||||||
|
ii. |
Pro forma Adjusted Operating Margin per Barrel: $0.42 (previously reported as $0.50) |
||||||||
|
b. |
Nine months ended September 30, 2025: | ||||||||
|
i. |
Pro forma Adjusted Operating Margin: $311,818 (previously reported as $359,256) |
||||||||
|
ii. |
Pro forma Adjusted Operating Margin per Barrel: $0.41 (previously reported as $0.48) |
||||||||
Contacts
Scott McNeely
Chief Financial Officer
Contact@wbinfra.com
Mae Herrington
Director, Investor Relations
ir@wbinfra.com
Media
Daniel Yunger / Nathaniel Shahan
Kekst CNC
daniel.yunger@kekstcnc.com / nathaniel.shahan@kekstcnc.com