U.S. Housing Market Expected to Stabilize in 2026
U.S. Housing Market Expected to Stabilize in 2026
- Home price growth continued its downward trend in November 2025.
- Northeast and Midwest hubs, including Newark, NJ; Chicago, IL; and Milwaukee, WI, saw annual price growth gain traction in November.
- Major metro areas in Florida and Texas led the nation in annual market depreciation.
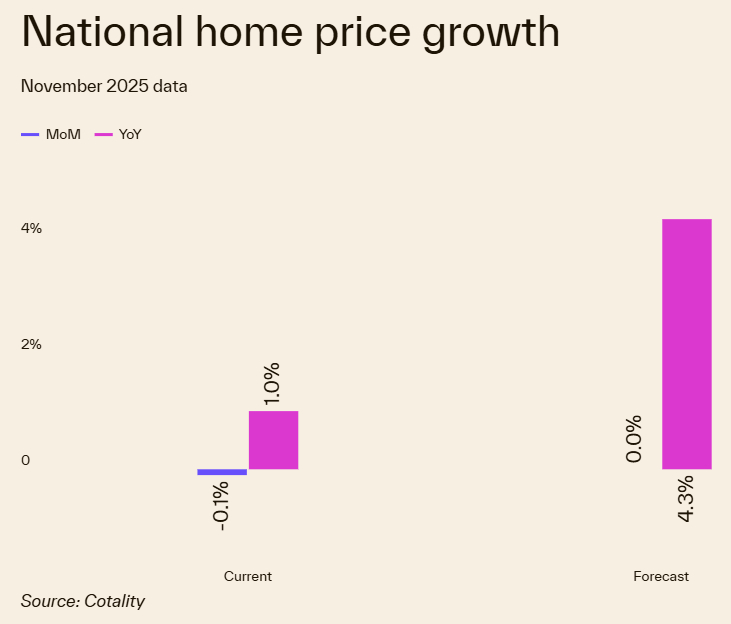
IRVINE, Calif.--(BUSINESS WIRE)--Cotality™, a leader in property information, analytics, and data-enabled solutions, released its Home Price Index™ for November 2025 data today. Home price growth slowed to just 1% year over year in November 2025.
"If mortgage rates decline as expected, we could see renewed momentum in the spring, spurring increased competition among buyers and potentially driving a re-acceleration of price gains in markets with limited inventory," Dr. Selma Hepp, Chief Economist.
Share
While the broader market stabilizes, Cotality experts are seeing the immediate impact of shifting federal priorities. Specifically, Washington, D.C. has surged to the second-fastest-depreciating market—up from sixth just a month ago—likely reflecting the early footprints of DOGE initiatives.
"Looking ahead to 2026, regional differences will remain pronounced, with demand favoring areas that offer both economic opportunity and relative affordability," said Dr. Selma Hepp, Cotality’s Chief Economist.
Top states for home price growth in November 2025
- Wyoming
- New Jersey
- Nebraska
- Illinois
- Connecticut
While price growth hit a 14-year low in late 2025, Cotality experts anticipate 2026 will bring a fresh wave of activity, especially if mortgage rates continue to ease. Although home price growth is likely to remain at the low end of the long-term average of 4% to 5%, the upcoming spring buying season should provide the improved affordability and wider inventory needed to re-engage sidelined buyers who have been waiting for the market to find its footing.
As the market enters 2026, inventory levels and mortgage rate trends will play pivotal roles in shaping the landscape. A drop in rates could unleash pent-up demand, but with supply still constrained in many regions, buyers may face competitive conditions, especially in desirable metros.
The expectation for the upcoming spring season is a seasonal uptick, driven by both returning buyers and those who delayed purchases during the previous year's slowdown. Ultimately, 2026 is poised to be a year where adaptability and local market knowledge will be key for both buyers and sellers, but buyers should see more opportunities than in recent years.
"If mortgage rates decline as expected, we could see renewed momentum in the spring, spurring increased competition among buyers and potentially driving a re-acceleration of price gains in markets with limited inventory," Hepp noted.
The next Cotality Home Price Index will be released on February 3, 2026, featuring data for November 2025. For ongoing housing trends and data, visit the Cotality Insights blog: www.cotality.com/insights.
Methodology
The Cotality HPI™ is built on industry-leading public record, servicing, and securities real-estate databases and incorporates more than 45 years of repeat-sales transactions for analyzing home price trends. Generally released on the first Tuesday of each month with an average five-week lag, the Cotality HPI is designed to provide an early indication of home price trends by market segment and for the Single-Family Combined tier, representing the most comprehensive set of properties, including all sales for single-family attached and single-family detached properties. The indices are fully revised with each release and employ techniques to signal turning points sooner. The Cotality HPI provides measures for multiple market segments, referred to as tiers, based on property type, price, time between sales, loan type (conforming vs. non-conforming) and distressed sales. Broad national coverage is available from the national level down to ZIP Code, including non-disclosure states.
Cotality HPI Forecasts™ are based on a two-stage, error-correction econometric model that combines the equilibrium home price—as a function of real disposable income per capita—with short-run fluctuations caused by market momentum, mean-reversion, and exogenous economic shocks like changes in the unemployment rate. With a 30-year forecast horizon, Cotality HPI Forecasts project Cotality HPI levels for two tiers — Single-Family Combined (both attached and detached) and Single-Family Combined Excluding Distressed Sales. As a companion to the Cotality HPI Forecasts, Stress-Testing Scenarios align with Comprehensive Capital Analysis and Review (CCAR) national scenarios to project five years of home prices under baseline, adverse and severely adverse scenarios at state, metropolitan areas and ZIP Code levels. The forecast accuracy represents a 95% statistical confidence interval with a +/- 2% margin of error for the index.
About Market Risk Indicators
Market Risk Indicators are a subscription-based analytics solution that provide monthly updates on the overall health of housing markets across the country. Cotality data scientists combine world-class analytics with detailed economic and housing data to help determine the likelihood of a housing bubble burst in 392 major metros and all 50 states. Market Risk Indicators is a multi-phase regression model that provides a probability score (from 1 to 100) on the likelihood of two scenarios per metro: a >10% price reduction and a ≤ 10% price reduction. The higher the score, the higher the risk of a price reduction.
About the Market Condition Indicators
As part of the Cotality HPI and HPI Forecasts offerings, Market Condition Indicators are available for all metropolitan areas and identify individual markets as overvalued, at value or undervalued. These indicators are derived from the long-term fundamental values, which are a function of real disposable income per capita. Markets are labeled as overvalued if the current home price indexes exceed their long-term values by greater than 10% and undervalued where the long-term values exceed the index levels by greater than 10%.
Source: Cotality
The data provided are for use only by the primary recipient or the primary recipient's publication or broadcast. This data may not be resold, republished or licensed to any other source, including publications and sources owned by the primary recipient's parent company without prior written permission from Cotality. Any Cotality data used for publication or broadcast, in whole or in part, must be sourced as coming from Cotality, a data and analytics company. For use with broadcast or web content, the citation must directly accompany first reference of the data. If the data are illustrated with maps, charts, graphs or other visual elements, the Cotality logo must be included on screen or website. For questions, analysis or interpretation of the data, contact Charity Head at newsmedia@cotality.com. Data provided may not be modified without the prior written permission of Cotality. Do not use the data in any unlawful manner. The data are compiled from public records, contributory databases and proprietary analytics, and its accuracy is dependent upon these sources.
About Cotality
Cotality accelerates data, insights, and workflows across the property ecosystem to enable industry professionals to surpass their ambitions and impact society. With billions of real-time data signals across the life cycle of a property, we unearth hidden risks and transformative opportunities for agents, lenders, carriers, and innovators. Get to know us at www.cotality.com.
Contacts
Media Contact
Charity Head
Cotality
newsmedia@cotality.com