CoreLogic: US Home Equity Gains Rose Annually in Q3 but Fell Sharply From Q2
CoreLogic: US Home Equity Gains Rose Annually in Q3 but Fell Sharply From Q2
- Homeowners posted average annual equity gains of $34,300 in the third quarter of 2022, which was about half the year-over-year increase recorded in the second quarter.
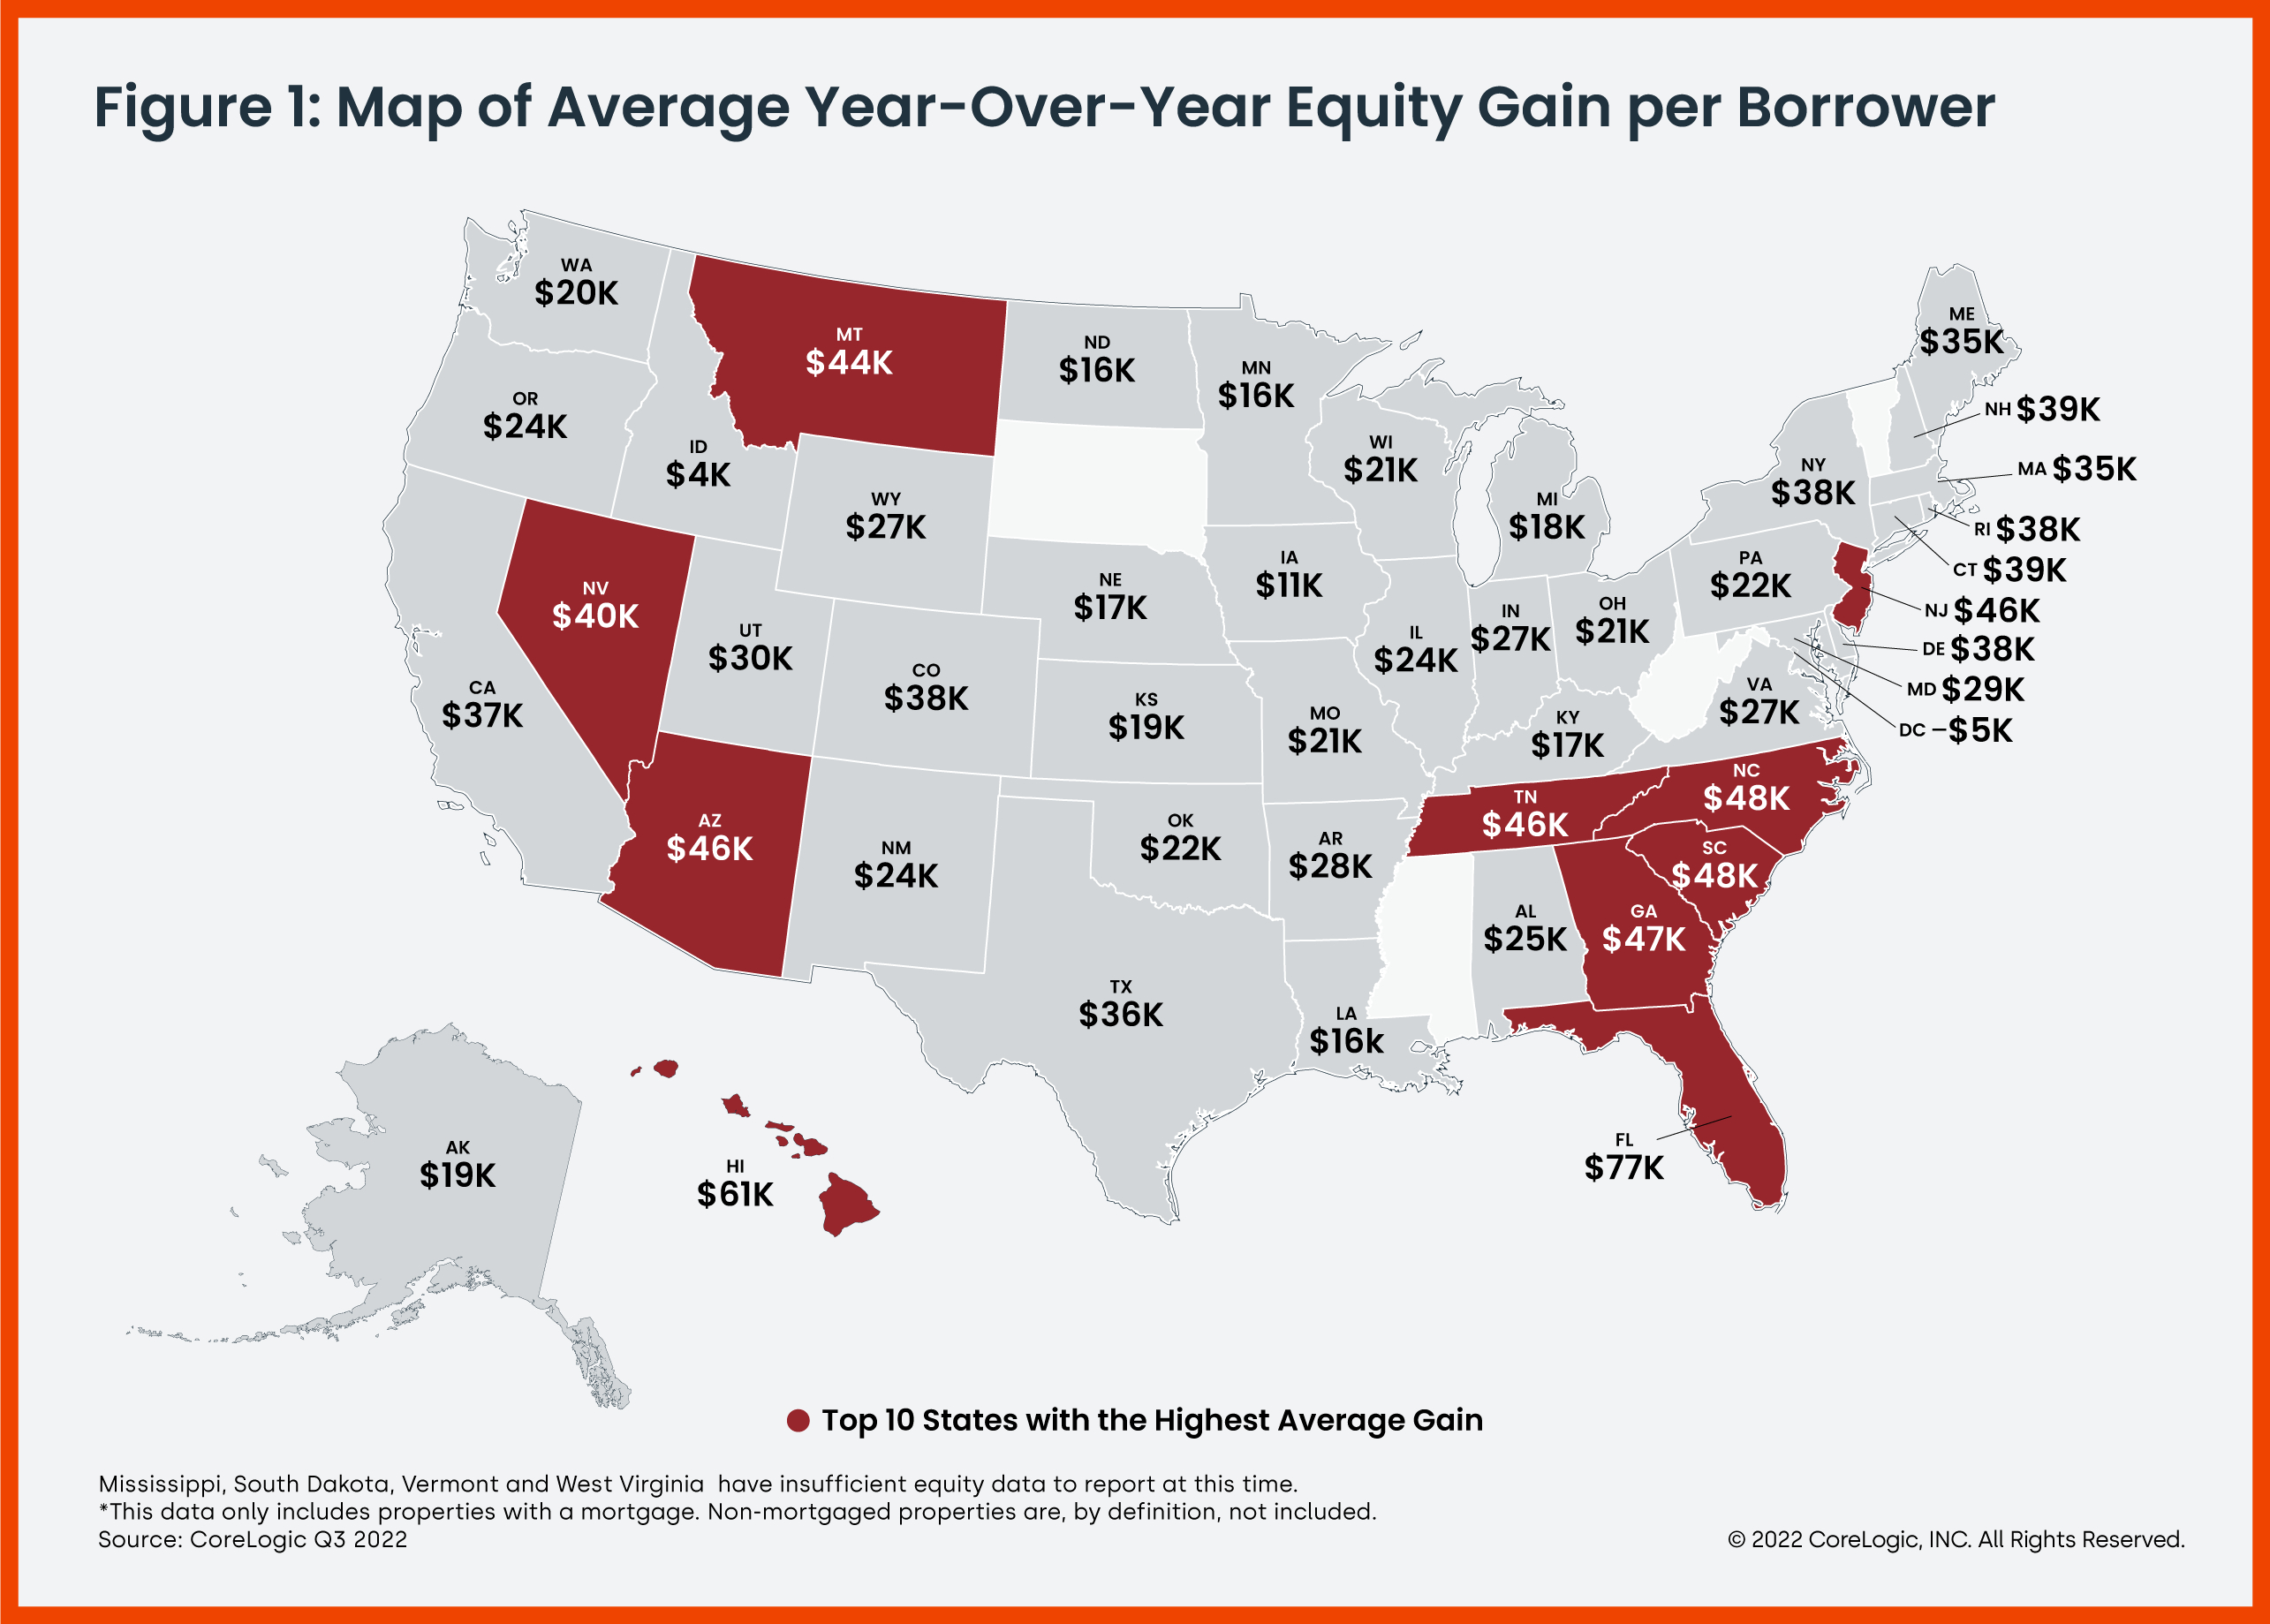
- Florida led the U.S. for annual home equity increases at $76,700, with Miami in the No. 1 spot among major metro areas at $101,000 gain per borrower.
IRVINE, Calif.--(BUSINESS WIRE)--CoreLogic®, a leading global property information, analytics and data-enabled solutions provider, today released the Homeowner Equity Report (HER) for the third quarter of 2022. The report shows that U.S. homeowners with mortgages (which account for roughly 63% of all properties) saw equity increase by 15.8% year over year, representing a collective gain of $2.2 trillion, for an average of $34,300 per borrower, since the third quarter of 2021.
Nationwide, annual home equity gains began to slow in the third quarter of 2022, with the average borrower netting $34,300, compared with the nearly $60,000 year-over-year gain recorded in the second quarter. Slowing prices also caused an additional 43,000 properties to fall underwater. The quarter-over-quarter decline in equity is partially due to cooling home price growth across the country, as annual appreciation fell from about 18% in June to just slightly more than 10% in October. As home price gains are projected to relax into single digits for the rest of 2022, then possibly move into negative territory by the spring of 2023, equity increases will likely decline accordingly in some parts of the country.
“At 43.6%, the average U.S. loan-to-value (LTV) ratio is only slightly higher than in the past two quarters and still significantly lower than the 71.3% LTV seen moving into the Great Recession in the first quarter of 2010,” said Selma Hepp, interim lead of the Office of the Chief Economist at CoreLogic. “Therefore, today’s homeowners are in a much better position to weather the current housing slowdown and a potential recession than they were 12 years ago.”
“Weakening housing demand and the resulting decline in home prices since the spring’s peak reduced annual home equity gains and pushed an additional number of properties underwater in the third quarter,” said Hepp. “Nevertheless, while these negative impacts are concentrated in Western states such as California, homeowners with a mortgage there still average more than $580,000 in home equity.”
Negative equity, also referred to as underwater or upside-down mortgages, applies to borrowers who owe more on their mortgages than their homes are currently worth. As of the third quarter of 2022, the quarterly and annual changes in negative equity were:
- Quarterly change: From the second quarter of 2022 to the third quarter of 2022, the total number of mortgaged homes in negative equity increased by 4% to 1.1 million homes or 1.9% of all mortgaged properties.
- Annual change: In the third quarter of 2021, 1.2 million homes, or 2.2% of all mortgaged properties, were in negative equity. This number declined by 9.8% in the third quarter of 2022, to 1.1 million homes or 1.9% of all mortgage properties.
Because home equity is affected by home price changes, borrowers with equity positions near (+/- 5%), the negative equity cutoff, are most likely to move out of or into negative equity as prices change, respectively. Looking at the third quarter of 2022 book of mortgages, if home prices increase by 5%, 127,000 homes would regain equity; if home prices decline by 5%, 172,000 properties would fall underwater.
The next CoreLogic Homeowner Equity Report will be released in March 2023, featuring data for Q4 2022. For ongoing housing trends and data, visit the CoreLogic Intelligence Blog: www.corelogic.com/intelligence.
Methodology
The amount of equity for each property is determined by comparing the estimated current value of the property against the mortgage debt outstanding (MDO). If the MDO is greater than the estimated value, then the property is determined to be in a negative equity position. If the estimated value is greater than the MDO, then the property is determined to be in a positive equity position. The data is first generated at the property level and aggregated to higher levels of geography. CoreLogic uses public record data as the source of the MDO, which includes more than 50 million first- and second mortgage liens and is adjusted for amortization and home equity utilization in order to capture the true level of MDO for each property. Only data for mortgaged residential properties that have a current estimated value are included. There are several states or jurisdictions where the public record, current value or mortgage data coverage is thin and have been excluded from the analysis. These instances account for fewer than 5% of the total U.S. population. The percentage of homeowners with a mortgage is from the 2019 American Community Survey. Data for the previous quarter was revised. Revisions with public records data are standard, and to ensure accuracy, CoreLogic incorporates the newly released public data to provide updated results.
Source: CoreLogic
The data provided is for use only by the primary recipient or the primary recipient's publication or broadcast. This data may not be re-sold, republished or licensed to any other source, including publications and sources owned by the primary recipient's parent company without prior written permission from CoreLogic. Any CoreLogic data used for publication or broadcast, in whole or in part, must be sourced as coming from CoreLogic, a data and analytics company. For use with broadcast or web content, the citation must directly accompany first reference of the data. If the data is illustrated with maps, charts, graphs or other visual elements, the CoreLogic logo must be included on screen or website. For questions, analysis or interpretation of the data, contact Robin Wachner at newsmedia@corelogic.com. For sales inquiries, contact sales@corelogic.com. Data provided may not be modified without the prior written permission of CoreLogic. Do not use the data in any unlawful manner. This data is compiled from public records, contributory databases and proprietary analytics, and its accuracy is dependent upon these sources.
About CoreLogic
CoreLogic is a leading global property information, analytics and data-enabled solutions provider. The company's combined data from public, contributory and proprietary sources includes over 4.5 billion records spanning more than 50 years, providing detailed coverage of property, mortgages and other encumbrances, consumer credit, tenancy, location, hazard risk and related performance information. The markets CoreLogic serves include real estate and mortgage finance, insurance, capital markets, and the public sector. CoreLogic delivers value to clients through unique data, analytics, workflow technology, advisory and managed services. Clients rely on CoreLogic to help identify and manage growth opportunities, improve performance and mitigate risk. Headquartered in Irvine, Calif., CoreLogic operates in North America, Western Europe and Asia Pacific. For more information, please visit www.corelogic.com.
CORELOGIC and the CoreLogic logo are trademarks of CoreLogic, Inc. and/or its subsidiaries. All other trademarks are the property of their respective owners.
Contacts
Media Contact:
Robin Wachner
newsmedia@corelogic.com
Sales Contact:
sales@corelogic.com