Aktiun Announces ChartFactor Py - Interactive Visual Analytics For Pandas DataFrames
Aktiun Announces ChartFactor Py - Interactive Visual Analytics For Pandas DataFrames
Powerful visualizations and instant filtering give JupyterLab, Jupyter Notebook, and Kaggle users improved productivity when working with their Pandas DataFrames
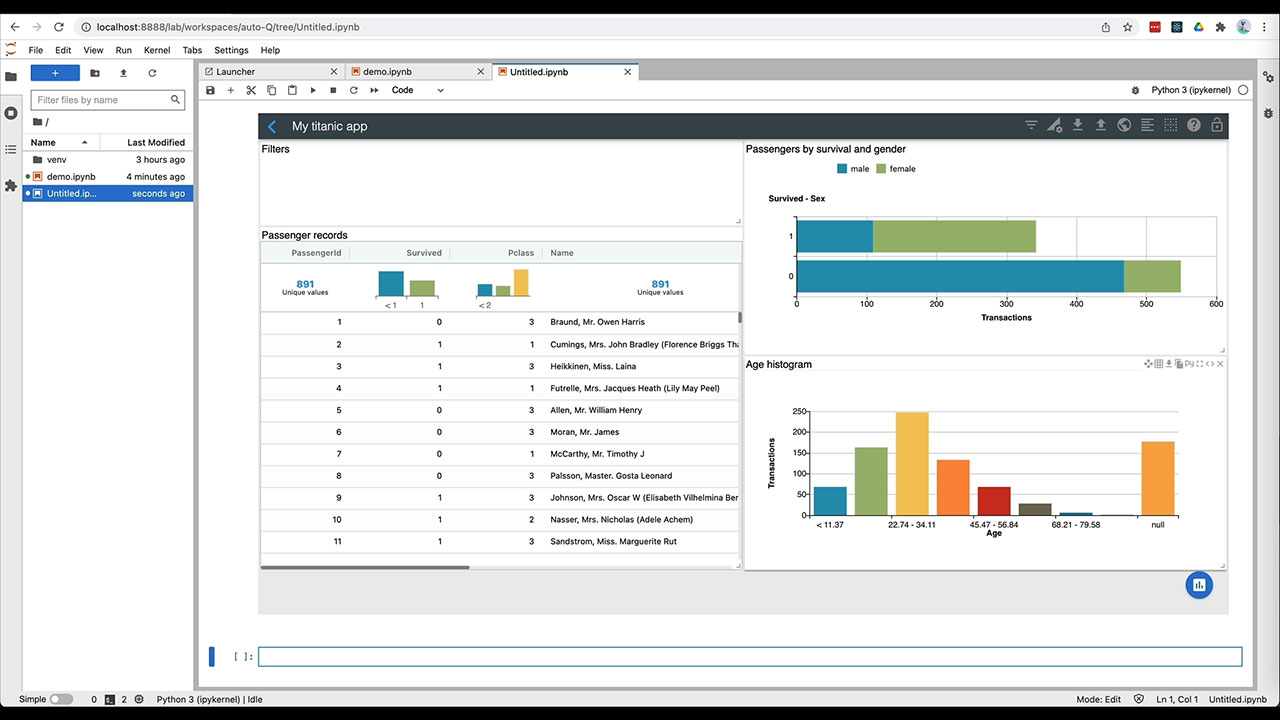
This video shows how you can use ChartFactor Py to visually interact with your Pandas DataFrames using JupyterLab, Jupyter Notebooks, and Kaggle. With ChartFactor Py, you can easily create beautiful web-based visualizations and interact with them using the ChartFactor Studio canvas. You can visually examine column statistics, create multiple charts, filter between them, and use the "Copy code" function to render your key findings and results on different cells without having to write code or google syntax.
FAIRFAX, Va.--(BUSINESS WIRE)--Aktiun (www.aktiun.com) announced today the release of ChartFactor Py, a Python package built on top of ChartFactor, the lightweight visual analytics platform, to enable powerful visual analytics for Pandas Dataframes without having to write code and without moving users data.
ChartFactor Py enables users to easily create beautiful web-based visualizations and interact with them using the ChartFactor Studio canvas in their JupyterLab and Jupyter Notebook environments. Users can visually examine column statistics, create many charts, filter between them, and use the "Copy code" function to render key findings and results on different cells without having to write code or google syntax.
In addition to Pandas DataFrames, ChartFactor Studio enables users to point to modern data engines such as BigQuery and Elasticsearch to create technology-agnostic data applications that they can publish to the web server of their choice. This powerful combination brings the work product of data scientists closer to end users for faster exploration and exploitation of their work.
Aktiun also announced today its 3.0 version of the ChartFactor Platform, packed with customer-driven improvements and amazing value for its community users. This release includes animation and rendering improvements for tables and charts, it expands its Studio’s user-friendly configuration to many more visualizations, and it brings its new Intelligent Code Updater (ICU) engine for Studio to provide accurate code generation while also allowing users to edit that same code, deployed initially on Studio’s metadata component.
“The lightweight architecture of ChartFactor means visual analytics without the cost and complexity of integrating a traditional BI tool” said Jorge Alarcon, founder and CEO of Aktiun. “ChartFactor's edge computing design means that data applications can scale to tens of thousands of users and petabytes of data, only limited by the scalability of their data engine.”
About Aktiun
Aktiun helps enterprises and their developers with large implementations of their next generation data analytics in private, public and hybrid cloud environments. Founded in March 2016 by industry veteran Jorge Alarcon, Aktiun currently has customers in the US and Europe.
For more information, visit https://www.aktiun.com/.
For more information on ChartFactor, visit https://www.chartfactor.com.
Contacts
Patricia Alarcon
patricia@aktiun.com