Powering Up in 2020: Annual U.S. Home Price Appreciation Jumped to Six-Year High in September, CoreLogic Reports
Powering Up in 2020: Annual U.S. Home Price Appreciation Jumped to Six-Year High in September, CoreLogic Reports
- Up 6.7% in September, U.S. Home Price Index experienced the fastest annual acceleration since May 2014
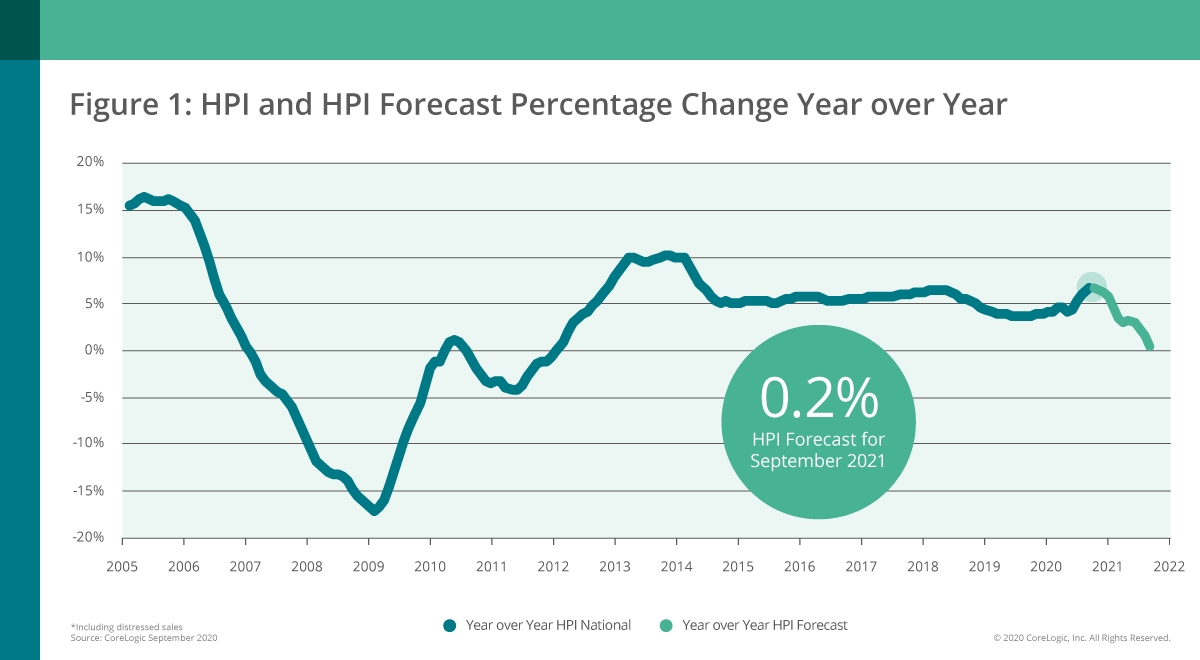
- HPI Forecast predicts home price growth will slow through September 2021
IRVINE, Calif.--(BUSINESS WIRE)--CoreLogic® (NYSE: CLGX), a leading global property information, analytics and data-enabled solutions provider, today released the CoreLogic Home Price Index (HPI™) and HPI Forecast™ for September 2020. Nationally, home prices increased 6.7% in September 2020, compared with September 2019, marking the fastest annual acceleration since May 2014. On a month-over-month basis, home prices increased by 1.1% compared to August 2020.
Home-purchase demand maintained pace in the late summer compared to previous years, as record-low mortgage rates continue to motivate prospective homebuyers, including first-time buyers and homeowners looking to trade-up or invest in a second home. However, according to the National Association of Realtors and U.S. Census Bureau, the national supply of homes for sale fell to the lowest recorded level in September at 40% of that seen in September 2008 and 75% of that seen in September 2000. This severe inventory shortage has intensified upward pressure on home price appreciation as consumers compete for the limited number of homes on the market.
“Housing continues to be a bright spot during an otherwise challenging economic time for many U.S. households,” said Frank Martell, president and CEO of CoreLogic. “Those in sectors that weathered the transition to remote work successfully are now able to take advantage of low mortgage rates to purchase a home for the first time or to trade-up to a larger home.”
“COVID has contributed to the acute shortage of inventory as the pace of new construction slowed and older prospective sellers postponed listing their homes until after the pandemic,” said Dr. Frank Nothaft, chief economist at CoreLogic. “Once the pandemic passes or a vaccine is widely administered, we should see a noticeable pick-up in for-sale homes. And if the economy’s recovery is sluggish next year, distressed sales may also add to market inventory.”
Despite the rapid acceleration of national home price growth, local markets continue to vary. For instance, in Phoenix, where there is a severe shortage of for-sale homes, prices increased 11.1% in September. Meanwhile, the New York-Jersey City-White Plains metro recorded only a small annual increase in home prices of 0.3%, as residents opt for more space and privacy in less densely populated areas. By state, Idaho, Arizona and Maine experienced the strongest price growth in September, up 11.8%, 11% and 11%, respectively.
Looking forward, the HPI Forecast shows national home price increases slowing to 0.2% over the next 12 months as eroding affordability and increased for-sale inventory moderates appreciation. However, should the economic recovery be more robust, then we would expect projections for home price performance to improve.
The HPI Forecast also reveals the disparity in expected home price growth across metros. In markets like Las Vegas, where the local tourism economy and job market continue to struggle, home prices are expected to decline 5.6% by September 2021. Conversely, in San Diego, home prices are forecasted to increase 5.7% over the next 12 months as low inventory continues to push prices up.
The CoreLogic Market Risk Indicator (MRI), a monthly update of the overall health of housing markets across the country, predicts that metros such as Las Vegas and Miami — areas that have been hard hit by the collapse of the tourism market — are at the greatest risk (above 70%) of a decline in home prices over the next 12 months. Other metro areas with a high risk of price declines include Lake Charles, Louisiana; Springfield, Massachusetts and Prescott, Arizona.
The next CoreLogic HPI press release, featuring October 2020 data, will be issued on December 1 at 8:00 a.m. ET.
Methodology
The CoreLogic HPI™ is built on industry-leading public record, servicing and securities real-estate databases and incorporates more than 40 years of repeat-sales transactions for analyzing home price trends. Generally released on the first Tuesday of each month with an average five-week lag, the CoreLogic HPI is designed to provide an early indication of home price trends by market segment and for the “Single-Family Combined” tier, representing the most comprehensive set of properties, including all sales for single-family attached and single-family detached properties. The indices are fully revised with each release and employ techniques to signal turning points sooner. The CoreLogic HPI provides measures for multiple market segments, referred to as tiers, based on property type, price, time between sales, loan type (conforming vs. non-conforming) and distressed sales. Broad national coverage is available from the national level down to ZIP Code, including non-disclosure states.
CoreLogic HPI Forecasts™ are based on a two-stage, error-correction econometric model that combines the equilibrium home price—as a function of real disposable income per capita—with short-run fluctuations caused by market momentum, mean-reversion, and exogenous economic shocks like changes in the unemployment rate. With a 30-year forecast horizon, CoreLogic HPI Forecasts project CoreLogic HPI levels for two tiers — “Single-Family Combined” (both attached and detached) and “Single-Family Combined Excluding Distressed Sales.” As a companion to the CoreLogic HPI Forecasts, Stress-Testing Scenarios align with Comprehensive Capital Analysis and Review (CCAR) national scenarios to project five years of home prices under baseline, adverse and severely adverse scenarios at state, metropolitan areas and ZIP Code levels. The forecast accuracy represents a 95% statistical confidence interval with a +/- 2% margin of error for the index.
About Market Risk Indicator
Market Risk Indicators are a subscription-based analytics solution that provide monthly updates on the overall “health” of housing markets across the country. CoreLogic data scientists combine world-class analytics with detailed economic and housing data to help determine the likelihood of a housing bubble burst in 392 major metros and all 50 states. Market Risk Indicators is a multi-phase regression model that provides a probability score (from 1 to 100) on the likelihood of two scenarios per metro: a >10% price reduction and a ≤ 10% price reduction. The higher the score, the higher the risk of a price reduction.
About the Market Condition Indicators
As part of the CoreLogic HPI and HPI Forecasts offerings, Market Condition Indicators are available for all metropolitan areas and identify individual markets as “overvalued”, “at value”, or “undervalued.” These indicators are derived from the long-term fundamental values, which are a function of real disposable income per capita. Markets are labeled as overvalued if the current home price indexes exceed their long-term values by greater than 10%, and undervalued where the long-term values exceed the index levels by greater than 10%.
Source: CoreLogic
The data provided are for use only by the primary recipient or the primary recipient's publication or broadcast. This data may not be resold, republished or licensed to any other source, including publications and sources owned by the primary recipient’s parent company without prior written permission from CoreLogic. Any CoreLogic data used for publication or broadcast, in whole or in part, must be sourced as coming from CoreLogic, a data and analytics company. For use with broadcast or web content, the citation must directly accompany first reference of the data. If the data are illustrated with maps, charts, graphs or other visual elements, the CoreLogic logo must be included on screen or website. For questions, analysis or interpretation of the data, contact Valerie Sheets at newsmedia@corelogic.com. Data provided may not be modified without the prior written permission of CoreLogic. Do not use the data in any unlawful manner. The data are compiled from public records, contributory databases and proprietary analytics, and its accuracy is dependent upon these sources.
About CoreLogic
CoreLogic (NYSE: CLGX), the leading provider of property insights and solutions, promotes a healthy housing market and thriving communities. Through its enhanced property data solutions, services and technologies, CoreLogic enables real estate professionals, financial institutions, insurance carriers, government agencies and other housing market participants to help millions of people find, buy and protect their homes. For more information, please visit www.corelogic.com.
CORELOGIC, the CoreLogic logo, CoreLogic HPI and CoreLogic HPI Forecast are trademarks of CoreLogic, Inc. and/or its subsidiaries. All other trademarks are the property of their respective owners.
Contacts
Media Contacts:
Valerie Sheets
newsmedia@corelogic.com