Continued Strength and Resiliency: CoreLogic Reports Home Price Growth Accelerated in June
Continued Strength and Resiliency: CoreLogic Reports Home Price Growth Accelerated in June
- CoreLogic HPI reports a 4.9% year-over-year increase in June, up from the 4.1% annual gain reported for May
- The HPI Forecast shows home prices will continue to post annual gains through 2020, with a moderate 1% decline from June 2020 to June 2021
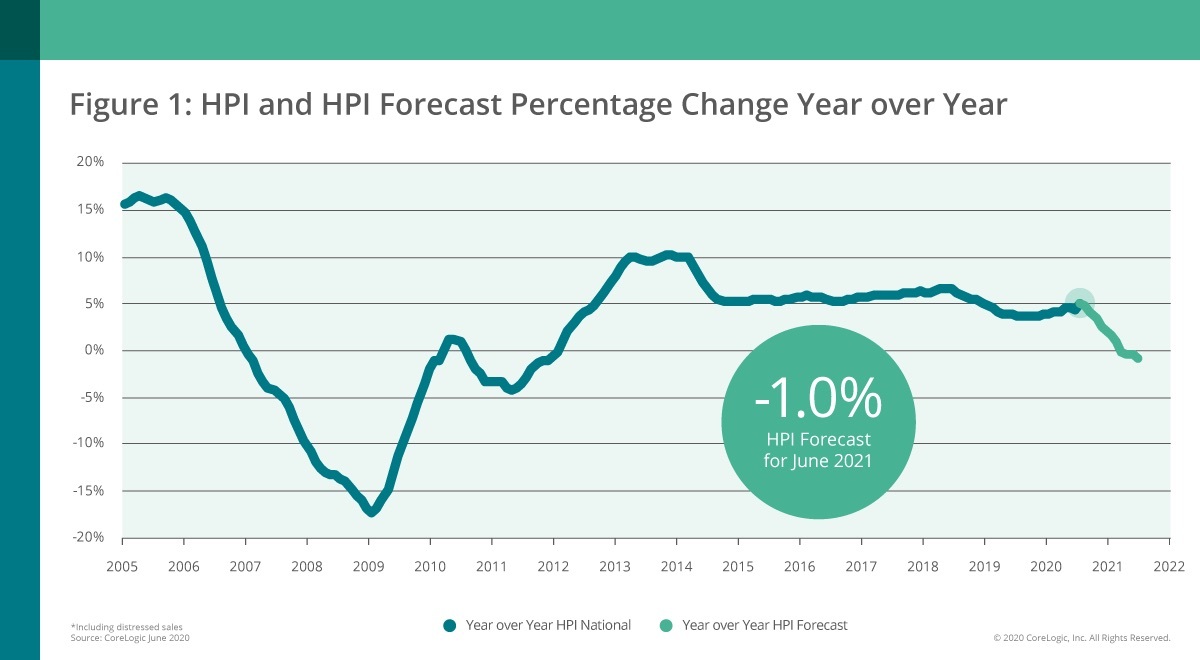
IRVINE, Calif.--(BUSINESS WIRE)--CoreLogic® (NYSE: CLGX), a leading global property information, analytics and data-enabled solutions provider, today released the CoreLogic Home Price Index (HPI™) and HPI Forecast™ for June 2020. Nationally, home prices increased by 4.9% in June 2020, compared with June 2019. Month over month, home prices increased 1%, compared with May of this year, the fastest monthly gain for the month of June since 2013.
CoreLogic’s HPI forecast predicts a modest decline in home prices over the twelve months ending June 2021. A sign of a solid foundation and resiliency in the housing market in the face of the pandemic, stronger home prices this summer reflect improved affordability, demographic demands, supply constraints and continued strong interest in purchasing a home. These factors combined to keep home prices steady despite the continued pressure of the pandemic and related economic fall-out.
“Mortgage rates hit record lows this spring, which enhanced affordability for home buyers,” said Dr. Frank Nothaft, chief economist at CoreLogic. “First-time buyers, and millennials in particular, have jumped at the opportunity to achieve homeownership.”
“Home price appreciation continues at a solid pace, reflecting fundamental strength in demand drivers and limited for-sale inventory,” said Frank Martell, president and CEO of CoreLogic. “As we move forward, we expect these price increases to moderate over the next twelve months. Given the economic outlook, housing remains a bright spot for the foreseeable future.”
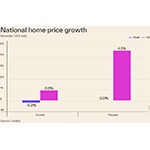
Despite the renewed pickup of national home price growth, the impact on local markets continues to fluctuate. For example, home prices in Philadelphia experienced an annual gain of 8.4% in June, driven by an uptick in New York City residents purchasing homes, likely in an effort to migrate from the coronavirus (COVID-19) hotspot. Meanwhile, affordability constraints in San Francisco led to an annual decline in home prices of 0.2%.
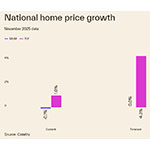
Looking forward, the HPI Forecast also reveals the disparity of home prices across metros. In markets like Las Vegas, where the local tourism economy and job market continue to suffer due to the pandemic, home prices are expected to decline 11.3% by June 2021. Meanwhile, in San Diego, home prices are forecasted to increase 4.2% over the next 12 months as lack of inventory continues to push prices up.
The CoreLogic Market Risk Indicator (MRI), a monthly update of the overall health of housing markets across the country, predicts that metro areas with an elevated resurgence of COVID-19 cases—like Prescott, Arizona, and Lake Havasu, Arizona—are at the greatest risk (above 60%) of a decline in home prices over the next 12 months. Other metro areas with a high risk of price declines include Las Vegas, Nevada; Peoria, Illinois; and Worchester, Massachusetts.
The next CoreLogic HPI press release, featuring July 2020 data, will be issued on September 1 at 8:00 a.m. ET.
Methodology
The CoreLogic HPI™ is built on industry-leading public record, servicing and securities real-estate databases and incorporates more than 40 years of repeat-sales transactions for analyzing home price trends. Generally released on the first Tuesday of each month with an average five-week lag, the CoreLogic HPI is designed to provide an early indication of home price trends by market segment and for the “Single-Family Combined” tier, representing the most comprehensive set of properties, including all sales for single-family attached and single-family detached properties. The indices are fully revised with each release and employ techniques to signal turning points sooner. The CoreLogic HPI provides measures for multiple market segments, referred to as tiers, based on property type, price, time between sales, loan type (conforming vs. non-conforming) and distressed sales. Broad national coverage is available from the national level down to ZIP Code, including non-disclosure states.
CoreLogic HPI Forecasts™ are based on a two-stage, error-correction econometric model that combines the equilibrium home price—as a function of real disposable income per capita—with short-run fluctuations caused by market momentum, mean-reversion, and exogenous economic shocks like changes in the unemployment rate. With a 30-year forecast horizon, CoreLogic HPI Forecasts project CoreLogic HPI levels for two tiers — “Single-Family Combined” (both attached and detached) and “Single-Family Combined Excluding Distressed Sales.” As a companion to the CoreLogic HPI Forecasts, Stress-Testing Scenarios align with Comprehensive Capital Analysis and Review (CCAR) national scenarios to project five years of home prices under baseline, adverse and severely adverse scenarios at state, metropolitan areas and ZIP Code levels. The forecast accuracy represents a 95% statistical confidence interval with a +/- 2% margin of error for the index.
About Market Risk Indicator
Market Risk Indicators are a subscription-based analytics solution that provide monthly updates on the overall “health” of housing markets across the country. CoreLogic data scientists combine world-class analytics with detailed economic and housing data to help determine the likelihood of a housing bubble burst in 392 major metros and all 50 states. Market Risk Indicators is a multi-phase regression model that provides a probability score (from 1 to 100) on the likelihood of two scenarios per metro: a >10% price reduction and a ≤ 10% price reduction. The higher the score, the higher the risk of a price reduction.
About the Market Condition Indicators
As part of the CoreLogic HPI and HPI Forecasts offerings, Market Condition Indicators are available for all metropolitan areas and identify individual markets as “overvalued”, “at value”, or “undervalued.” These indicators are derived from the long-term fundamental values, which are a function of real disposable income per capita. Markets are labeled as overvalued if the current home price indexes exceed their long-term values by greater than 10%, and undervalued where the long-term values exceed the index levels by greater than 10%.
Source: CoreLogic
The data provided are for use only by the primary recipient or the primary recipient's publication or broadcast. This data may not be resold, republished or licensed to any other source, including publications and sources owned by the primary recipient’s parent company without prior written permission from CoreLogic. Any CoreLogic data used for publication or broadcast, in whole or in part, must be sourced as coming from CoreLogic, a data and analytics company. For use with broadcast or web content, the citation must directly accompany first reference of the data. If the data are illustrated with maps, charts, graphs or other visual elements, the CoreLogic logo must be included on screen or website. For questions, analysis or interpretation of the data, contact Allyse Sanchez at corelogic@ink-co.com. Data provided may not be modified without the prior written permission of CoreLogic. Do not use the data in any unlawful manner. The data are compiled from public records, contributory databases and proprietary analytics, and its accuracy is dependent upon these sources.
About CoreLogic
CoreLogic (NYSE: CLGX), the leading provider of property insights and solutions, promotes a healthy housing market and thriving communities. Through its enhanced property data solutions, services and technologies, CoreLogic enables real estate professionals, financial institutions, insurance carriers, government agencies and other housing market participants to help millions of people find, acquire and protect their homes. For more information, please visit www.corelogic.com.
CORELOGIC, the CoreLogic logo, CoreLogic HPI and CoreLogic HPI Forecast are trademarks of CoreLogic, Inc. and/or its subsidiaries. All other trademarks are the property of their respective owners.
Contacts
Valerie Sheets
newsmedia@corelogic.com