

Newsroom
Sorted by: Latest
-
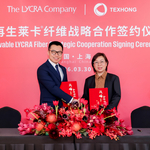
ザ・ライクラ・カンパニー、再生可能LYCRA®繊維に関する戦略的パートナーシップを発表
上海--(BUSINESS WIRE)--(ビジネスワイヤ) -- アパレルおよびパーソナルケア業界向けに革新的かつサステナブルな繊維ソリューションを提供するグローバル・リーダー、ザ・ライクラ・カンパニーは、世界最大級のコアスパン綿織物サプライヤーであるテクスホン・インターナショナル・グループ(以下「テクスホン」)と戦略的パートナーシップ契約を締結したことを発表しました。本契約に基づき、テクスホンはザ・ライクラ・カンパニーと独占的なパートナーシップを結び、植物由来成分を30%*含む再生可能LYCRA®繊維を中国のコアスパン糸セクターに導入します。今回の協力関係は、グローバルなアパレル・繊維産業におけるバイオ由来スパンデックスの採用を加速させることを目的としています。 30%の植物由来成分を含む再生可能LYCRA®繊維は、ザ・ライクラ・カンパニーが進めているサステナビリティーの高い素材の開発において最新の成果となります。デントコーンを原料の一部として使用したこの新製品は、従来の化石燃料由来のLYCRA®繊維が有する優れた伸縮性、快適性、耐久性を維持することが期待されています。最近公表さ...
-
Resumen: Brightfin unifica su marca tras la fusión con Proven Optics y marca un nuevo referente en la optimización del gasto tecnológico
ENGLEWOOD, Colorado--(BUSINESS WIRE)--Brightfin ha anunciado hoy que, tras su fusión con Proven Optics, la empresa resultante operará bajo una única marca: Brightfin. La nueva organización combina una amplia experiencia en gestión de gastos tecnológicos (TEM) y gestión financiera de TI (ITFM) para ayudar a las empresas a entender mejor, gestionar con mayor eficacia y reducir su gasto tecnológico total. Este año, el gasto tecnológico superará los 6 billones de dólares y, para la mayoría de las o...
-
Brightfin unifie ses marques à la suite d’une fusion avec Proven Optics, établissant ainsi une nouvelle norme en matière d’optimisation des coûts technologiques
ENGLEWOOD, Colorado--(BUSINESS WIRE)--Brightfin a annoncé aujourd’hui qu’à la suite de sa fusion avec Proven Optics, la société issue de cette opération exercera désormais ses activités sous une seule et même marque : Brightfin. Cette nouvelle entité réunit une expertise approfondie en matière de gestion des dépenses technologiques (Technology Expense Management, TEM) et de gestion financière informatique (IT Financial Management, ITFM), afin d’aider les organisations à mieux comprendre, à mieu...
-
グラディアント、英国のハイパースケールデータセンター向け大型水処理契約を受注
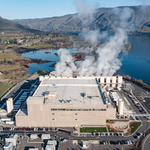
マサチューセッツ州ボストン--(BUSINESS WIRE)--(ビジネスワイヤ) -- グラディアントは、先進的な水処理および廃水処理ソリューションを提供する世界的リーダーとして、英国オックスフォードシャー州ディドコットのハイパースケールデータセンター向け水処理施設の設計・納入契約を受注しました。このプロジェクトは、旧発電所跡地で進められており、世界有数のAIおよびクラウドインフラプロバイダーの1社を支えるものです。 データセンターの拡大が加速する中、水はデータセンターをどこに、どのように建設し拡張できるかを左右する制約要因になりつつあります。事業者は、施設全体にわたって安定した水管理性能を確保できるパートナーをますます求めています。グラディアントは、処理、水再利用、ゼロ液体排出(ZLD)を含む統合ソリューションを提供します。このシステムは、水使用量と環境負荷を抑えながら、信頼性の高い冷却運用を実現するよう設計されています。 このプロジェクトは、施設全体の水管理性能に全面的な責任を負う、グラディアントの「敷地全体にわたって完全なる安心(Site-Wide Peace of Mind...

-
Gradiant斩获英国超大规模数据中心的重大水处理项目合同
马萨诸塞州波士顿--(BUSINESS WIRE)--(美国商业资讯)-- 全球先进水和废水处理解决方案领军企业Gradiant已获得一份合同,将为英国牛津郡迪德科特(Didcot)的一座超大规模数据中心设计和交付水处理设施。该项目将为全球顶尖的AI和云基础设施服务商提供支持,项目选址位于一座发电厂旧址。 随着数据中心建设加速推进,水资源正成为制约数据中心选址、建设和扩容的关键因素。运营商正越来越多地寻找能够保障整个园区水资源稳定供应的合作伙伴。Gradiant将提供一套覆盖处理、循环利用和零液体排放的集成解决方案。该系统旨在确保冷却运营稳定,同时减少用水量和环境影响。 该项目彰显了Gradiant的“园区级安心保障”理念,即全面负责整个设施的水资源运营表现。Gradiant并非将水资源视作独立公用事业,而是提供全面的水资源管理,将处理、再利用和运营可靠性融为一体,由单一责任主体合作伙伴提供服务。这一模式可降低风险、简化运营,并在资源日益紧张的环境下确保稳定表现。 Gradiant欧洲董事总经理Philipp Sausele表示:“该项目体现了我们如何将深厚的区域专业知识与Gradia...
-
Gradiant贏得英國超大規模資料中心的重大水處理專案合約
麻薩諸塞州波士頓--(BUSINESS WIRE)--(美國商業資訊)-- 全球先進水和廢水處理解決方案領軍企業Gradiant已獲得一份合約,將為英國牛津郡Didcot的一座超大規模資料中心設計和交付水處理設施。該專案將為全球頂尖的AI和雲端基礎設施服務商提供支援,專案選址位於一座發電廠舊址。 隨著資料中心加快成長,水資源正成為制約資料中心選址、建設和擴容的關鍵因素。營運商正越來越多地尋找能夠保障整個園區水資源穩定供應的合作夥伴。Gradiant將提供一套涵蓋處理、循環利用和零液體排放的整合式解決方案。該系統旨在確保冷卻營運穩定,同時減少用水量和環境衝擊。 該專案彰顯了Gradiant的「園區級安心保障」構想,即全面負責整個設施的水資源營運表現。Gradiant並非將水資源視作獨立公用事業,而是提供全面的水資源管理,將處理、再利用和營運可靠性融為一體,由單一責任主體合作夥伴提供服務。這一模式可降低風險、簡化營運,並在資源日益緊張的環境下確保穩定表現。 Gradiant歐洲董事總經理Philipp Sausele表示:「該專案體現了我們如何將深厚的區域專業知識與Gradiant的全球技...

-
Gradiant si aggiudica un importante contratto di fornitura idrica per un data center hyperscale nel Regno Unito
BOSTON, Mass.--(BUSINESS WIRE)--Gradiant, un leader globale in soluzioni all'avanguardia di fornitura idrica e smaltimento di acque reflue, ha ottenuto un contratto per la progettazione e la realizzazione di un impianto di trattamento idrico per un hyperscale data center a Didcot, in Oxfordshire, Regno Unito. Il progetto supporterà uno dei principali fornitori al mondo di infrastrutture per l'intelligenza artificiale e il cloud. I lavori di realizzazione del progetto sono già in corso nel sito...

-
Samenvatting: Brightfin verenigt merkactiviteiten na de fusie met Proven Optics en zet daarmee een nieuwe norm voor geoptimaliseerde kosten op technologisch gebied
ENGLEWOOD, Colo.--(BUSINESS WIRE)--Brightfin heeft vandaag bekendgemaakt dat het samengevoegde bedrijf, na de fusie met Proven Optics, onder één merknaam gaat opereren: Brightfin. Het gefuseerde bedrijf brengt diepgaande expertise op het gebied van Technology Expense Management (TEM) en IT Financial Management (ITFM) samen om organisaties te helpen beter inzicht in hun totale technologie-uitgaven te krijgen, voor een beter beheer en het verlagen van kosten. De uitgaven voor technologie zullen d...
-
Gradiant erhält umfangreichen Auftrag für Wasserlösungen eines britischen Hyperscale-Rechenzentrums
BOSTON, Massachusetts--(BUSINESS WIRE)--Gradiant, ein Weltmarktführer für fortschrittliche Wasser- und Abwasserlösungen, hat den Auftrag erhalten, eine Wasseraufbereitungsanlage für ein Hyperscale-Rechenzentrum in Didcot, Oxfordshire, im Vereinigten Königreich zu planen und zu liefern. Das Projekt wird einen der weltweit führenden Anbieter von KI- und Cloud-Infrastruktur unterstützen und auf dem Gelände eines ehemaligen Kraftwerks realisiert. Mit dem zunehmenden Wachstum von Rechenzentren spiel...

-
Riassunto: Brightfin unifica il marchio a seguito della fusione con Proven Optics, definendo un nuovo standard per l'ottimizzazione dei costi tecnologici
ENGLEWOOD, Colorado--(BUSINESS WIRE)--Brightfin ha annunciato oggi che, in seguito alla fusione con Proven Optics, la nuova società opererà con un unico marchio: Brightfin. La nuova società riunisce le profonde competenze nell'ambito della gestione delle spese tecnologiche (TEM) e della gestione finanziaria IT (ITFM) per aiutare le organizzazioni a comprendere meglio, gestire e ridurre la spesa complessiva in tecnologia. La spesa in tecnologia supererà i 6 trilioni di dollari quest'anno, e per...