

Newsroom
Sorted by: Latest
-
First Trust Global Funds PLC UK Regulatory Announcement: Net Asset Value(s)
LONDON--(BUSINESS WIRE)-- Funds Date TIDM ISIN Code Shares in Issue Currency Net Asset Value NAV/per Share First Trust FactorFX UCITS ETF 14.07.2026 FXGB LN IE00BD5HBR05 47,692.00 GBP 986,220.22 27.723 ...
-
First Trust Global Funds PLC UK Regulatory Announcement: Net Asset Value(s)
LONDON--(BUSINESS WIRE)-- Funds Date TIDM ISIN Code Shares in Issue Currency Net Asset Value NAV/per Share First Trust FactorFX UCITS ETF 14.07.2026 FTFX IE00BD5HBQ97 63,402.00 USD 1,735,892.76 27.379 ...
-
Marathon Asset Management Ltd UK Regulatory Announcement: Form 8.3
LONDON--(BUSINESS WIRE)-- FORM 8.3 PUBLIC OPENING POSITION DISCLOSURE/DEALING DISCLOSURE BY A PERSON WITH INTERESTS IN RELEVANT SECURITIES REPRESENTING 1% OR MORE Rule 8.3 of the Takeover Code (the “Code”) 1. KEY INFORMATION (a) Full name of discloser: Marathon Asset Management Limited (b) Owner or controller of interests and short positions disclosed, if different from 1(a): The naming of nominee or vehicle companies is insufficient. For a trust, the trustee(s), settlor and beneficiaries must...
-
First Trust Global Funds PLC UK Regulatory Announcement: Net Asset Value(s)
LONDON--(BUSINESS WIRE)-- Funds Date TIDM ISIN Code Shares in Issue Currency Net Asset Value NAV/per Share First Trust Vest US Equity Max Buffer UCITS ETF - March 14.07.2026 MMAR.LN IE0002PPCMH6 50,002.00 USD 1,334,066.47 26.680 ...
-
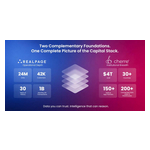
RealPage 收购 Cherre,打造覆盖房地产全资本链条的可信 AI 智能平台
美国得克萨斯州理查森和纽约--(BUSINESS WIRE)--(美国商业资讯)-- 房地产行业领先的 AI 赋能软件及数据分析解决方案提供商 RealPage, Inc 今日宣布,已完成对房地产数据智能公司 Cherre 的收购。Cherre 是一家深受全球机构业主、投资管理机构及运营商信赖的房地产数据智能企业。 RealPage 总裁兼首席执行官 Dirk Wakeham 表示:“AI 唯有真正理解房地产行业,才能推动行业实现变革。Cherre 打造了机构业主和资产管理机构所依赖的、具备完善治理机制和值得信赖的数据智能体系。将这一专业能力融入 RealPage 后,无论客户管理的是单一物业还是全球资产组合,都将拥有更加坚实、更加可信的数据基础,从而作出更明智的决策。” Cherre 联合创始人兼首席执行官 L.D. Salmanson 表示:“我们始终坚信,房地产企业无法仅凭数据本身作出充满信心的决策,他们需要的是数据背后可信且相互关联的业务语义。Cherre 所做的一切,都是为了迎接行业从‘数据报告’迈向‘智能推理’的关键时刻。加入 RealPage 后,我们将能够加快这一未来在...
-
RealPage收購Cherre,打造橫跨房地產全產業鏈的值得信賴的AI驅動智慧平台
德州理查森和紐約--(BUSINESS WIRE)--(美國商業資訊)-- 房地產業首屈一指的AI賦能軟體及資料分析解決方案供應商RealPage, Inc.今日宣布,已完成對深受全球機構業主、投資管理機構及營運商信賴的房地產資料智慧公司Cherre的收購。 RealPage總裁兼執行長Dirk Wakeham表示:「AI唯有真正理解房地產業,才能推動產業實現變革。Cherre打造了機構業主和資產管理機構所仰賴的、具備完善治理機制且值得信賴的資料代理系。將這一專業能力融入RealPage後,無論客戶管理的是單一物業還是全球資產組合,都將擁有更加堅實、更加可信的資料基礎,從而做出更明智的決策。」 Cherre共同創辦人兼執行長L.D. Salmanson表示:「我們始終堅信,房地產企業無法僅憑資料本身做出自信的決策。他們需要的是資料背後可信且相互關聯的業務語義。Cherre所做的一切,都是為了迎接產業從『 資料報告』邁向」智慧推理』的關鍵時刻。加入RealPage後,我們將能夠加快這一未來在真實資產生態系統中的落地,同時不會改變我們服務現有客戶的方式,持續為一直信賴我們的客戶創造價值。」...

-
RealPage rileva Cherre, creando una piattaforma di intelligence affidabile basata sull'AI nello spettro completo del capitale immobiliare
RICHARDSON, Texas e NEW YORK--(BUSINESS WIRE)--RealPage, Inc., un fornitore leader di software basato sull'intelligenza artificiale e di analisi dei dati per il settore immobiliare, oggi ha annunciato di aver completato l'acquisizione di Cherre, una società di intelligence dei dati immobiliari scelta da proprietari istituzionali, gestori di investimenti e operatori di tutto il mondo. "L'AI può trasformare il settore immobiliare solo se lo comprende", ha dichiarato Dirk Wakeham, Presidente e Amm...
-
RealPage verwerft Cherre en creëert een betrouwbaar, door AI aangedreven intelligence platform voor de volledige kapitaalstructuur van vastgoed.
RICHARDSON, Texas & NEW YORK--(BUSINESS WIRE)--RealPage, Inc., een toonaangevende leverancier van door AI aangestuurde software en gegevensanalyse voor de vastgoedsector, heeft vandaag bekendgemaakt dat de overname is afgerond van Cherre, een bedrijf op het gebied van gegevensintelligentie voor vastgoed dat wereldwijd wordt vertrouwd door institutionele eigenaren, beleggingsbeheerders en exploitanten. "AI kan de vastgoedsector alleen transformeren als het vastgoed begrijpt," zei Dirk Wakeham, P...

-
First Trust Global Funds PLC UK Regulatory Announcement: Net Asset Value(s)
LONDON--(BUSINESS WIRE)-- Funds Date TIDM ISIN Code Shares in Issue Currency Net Asset Value NAV/per Share First Trust Bloomberg Nuclear Power UCITS ETF 14.07.2026 RCTR.LN IE000J5PESP7 150,002.00 USD 2,645,561.30 17.637 ...
-
Marathon Asset Management Ltd UK Regulatory Announcement: Form 8.3
LONDON--(BUSINESS WIRE)-- FORM 8.3 PUBLIC OPENING POSITION DISCLOSURE/DEALING DISCLOSURE BY A PERSON WITH INTERESTS IN RELEVANT SECURITIES REPRESENTING 1% OR MORE Rule 8.3 of the Takeover Code (the “Code”) 1. KEY INFORMATION (a) Full name of discloser: Marathon Asset Management Limited (b) Owner or controller of interests and short positions disclosed, if different from 1(a): The naming of nominee or vehicle companies is insufficient. For a trust, the trustee(s), settlor and beneficiaries must...