

Newsroom
Sorted by: Latest
-
River Global Investors LLP UK Regulatory Announcement: Form 8.3
LONDON--(BUSINESS WIRE)-- FORM 8.3 PUBLIC OPENING POSITION DISCLOSURE/DEALING DISCLOSURE BY A PERSON WITH INTERESTS IN RELEVANT SECURITIES REPRESENTING 1% OR MORE Rule 8.3 of the Takeover Code (the “Code”) 1. KEY INFORMATION (a) Full name of discloser: River Global Investors LLP - 213800HIGHFCAY9K8Z97 (b) Owner or controller of interests and short positions disclosed, if different from 1(a): The naming of nominee or vehicle companies is insufficient. For a trust, the trustee(s), settlor and be...
-
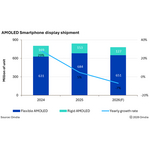
Omdia: AMOLED Smartphone Display Shipments Expected to Decline Sharply in 2026
LONDON--(BUSINESS WIRE)--AMOLED smartphone display shipments are expected to decline sharply in 2026 amid rising memory prices and increasing market uncertainty, according to Omdia’s latest OLED Display Market Tracker. A surge in memory prices since the second half of 2025 has significantly increased component costs for smartphones putting pressure on pricing for new models in 2026. Chinese smartphone brands, whose competitive strength lies in offering a broad portfolio at aggressive price poin...
-
Europe’s Technology Services Market Accelerates in Q1 on Higher Demand for AI: ISG Index™
LONDON--(BUSINESS WIRE)--Demand for technology services in Europe accelerated in the first quarter, fueled by strong AI-driven demand for cloud infrastructure: ISG Index....
-
Erste Group Offers Tailored Financing Solutions Across Countries Using FICO AI
BERLIN--(BUSINESS WIRE)--Erste Group Bank AG, the leading financial services provider in Central and Eastern Europe, has deployed optimization technology from FICO (NYSE: FICO) to enhance its customized pricing and limit strategies in order to offer tailored and more flexible financing terms. Customers benefit from optimization for mortgages, cash loans and other retail products. This project has earned Erste Group Bank a 2026 FICO® Decision Award for AI, Machine Learning & Optimization. Mo...
-
Samenvatting: SBC Medical onthult de prijs van de secundaire openbare aanbieding van 3,1 miljoen gewone aandelen
IRVINE, Calif.--(BUSINESS WIRE)--SBC Medical Group Holdings Incorporated (Nasdaq: SBC) ("het Bedrijf"), een Management Services Organization die actief is in een grote verscheidenheid aan franchiseactiviteiten in diverse medische domeinen, heeft vandaag de prijs bekendgemaakt van de onderschreven secundaire openbare aanbieding van 3.100.000 gewone aandelen van het bedrijf door Dr. Yoshiyuki Aikawa (de "Verkopende Aandeelhouder") tegen een uitgifteprijs van $ 3,25 per aandeel. Bovendien biedt de...
-
SOLUM and Rynly Partner to Advance Retail Fulfilment Through Connected Shelf-Edge Execution
LONDON--(BUSINESS WIRE)--SOLUM joins hands with Rynly to connect fulfillment intelligence with Newton ESLs, streamlining in-store picking...

-
IQOS and Devialet Introduce “Soundsorial Design” Collaboration
STAMFORD, CT--(BUSINESS WIRE)--Philip Morris International (NYSE: PM) today announced a collaboration between IQOS – the number 1 tobacco heating system1, and Devialet – the French acoustic engineering company, launching “Soundsorial Design” at Milan Design Week 2026. The immersive exhibition is an ethereal landscape of water and light, where sound, movement, and voice become visible across an ever‑changing immersive canvas. A space to push experiential boundaries, where visitors are invited to...
-
Europas Markt für Technologiedienstleistungen legt im ersten Quartal aufgrund der steigenden Nachfrage nach KI zu: ISG Index™
LONDON--(BUSINESS WIRE)--Die Nachfrage nach Technologiedienstleistungen in Europa hat sich im ersten Quartal weiter beschleunigt, angetrieben durch die starke Nachfrage nach den cloudbasierten Infrastrukturdiensten, die für den Betrieb von KI erforderlich sind. Dies zeigt der neueste Branchenbericht der Information Services Group (ISG) (Nasdaq: III), einem weltweit führenden Technologie-Research- und Beratungsunternehmen. Der EMEA ISG Index™, der kommerzielle Outsourcing-Verträge mit einem jähr...
-
Samenvatting: Europese markt voor technologische diensten versnelt in eerste kwartaal door toegenomen vraag naar AI: ISG Index™
LONDEN--(BUSINESS WIRE)--De vraag naar technologische diensten in Europa bleef in het eerste kwartaal versnellen, gedreven door de sterke vraag naar de cloudgebaseerde infrastructuurdiensten die nodig zijn om AI mogelijk te maken. Dit blijkt uit het nieuwste sectorrapport van Information Services Group (ISG) (Nasdaq: III), een toonaangevend wereldwijd onderzoeks- en adviesbureau op het gebied van technologie. De EMEA ISG Index™, die commerciële outsourcingcontracten meet met een jaarlijkse cont...
-
Le marché européen des services technologiques s’accélère au premier trimestre, en raison d'une demande accrue en IA : ISG Index™
LONDRES--(BUSINESS WIRE)--La demande de services technologiques en Europe a continué à monter en puissance au premier trimestre, portée par une forte demande de services d'infrastructure cloud nécessaires au fonctionnement de l'IA, comme le montre le dernier rapport sectoriel publié par Information Services Group (ISG) (Nasdaq : III), un cabinet international de premier plan spécialisé dans la recherche et le conseil en technologie. L'indice ISG™ en zone EMEA, qui mesure l'externalisation comme...