Newsroom
Sorted by: Latest
-
NeoGenomics to Present New Research at ASCO Annual Meeting 2026
FORT MYERS, Fla.--(BUSINESS WIRE)--NeoGenomics will showcase nine scientific abstracts at the 2026 ASCO Annual Meeting, May 29–June 2, 2026, in Chicago (booth #32130)....

-
Libretto Earns High Customer Satisfaction Ratings in 2026 Advisor Software Survey from T3 Technology Tools for Today and Inside Information
LOS ANGELES--(BUSINESS WIRE)--Libretto, the “total wealth” advice platform for RIAs and family offices, recently achieved high client satisfaction ratings in the 2026 T3 / Inside Information Software Survey1 – a widely referenced study in the wealthtech industry. Libretto earned the highest user satisfaction rating among firms with more than 1% market share in the Financial Planning Software and Portfolio Design Solutions categories. The results of the annual technology survey and report, produ...
-
American International College Partners with Sophia Learning to Expand Access to Education for Working Adult Learners
HERNDON, Va.--(BUSINESS WIRE)--Sophia Learning announces a new partnership with American International College (AIC)....

-
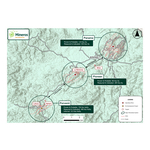
Mineros S.A. Identifies New High-Grade Vein System at the Nicaragua Property's Xiloa Target — 8.3 m at 17.3 g/t Au — Confirms High-Grade Continuity at Leticia with 1.2 m at 271.3 g/t Au
MEDELLÍN, Colombia--(BUSINESS WIRE)--Mineros S.A. (TSX:MSA, OTCQX: MNSAF, BVC:MINEROS) ("Mineros" or the "Company") is pleased to report initial results from its 2026 diamond drilling campaign at the Nicaragua Property. Results cover four target areas: Xiloa in the Pioneer Mine environs; the Leticia and Apoyo vein systems in the Porvenir Polymetallic District; La Reforma at the Pioneer Mine; and infill delineation at the Panamá Mine. HIGHLIGHTS New high-grade Vein System at Xiloa: 8.3 m at 17.3...
-
Buda Juice Dual Lists on the NYSE Texas Exchange
DALLAS--(BUSINESS WIRE)--Buda Juice, Inc. (NYSE American: BUDA), $BUDA, creator and pioneer of the Ultra Fresh category in the supermarket fresh perimeter, today announced the dual listing of its common stock on the NYSE Texas exchange, effective May 26, 2026. The Company will maintain its primary listing on the NYSE American. Horatio Lonsdale-Hands, Co-Founder and Chief Executive Officer of Buda Juice, commented: “Listing on the NYSE Texas exchange honors the place where Buda Juice got its sta...

-
TEGNA Inc. Names Patrick Paolini as Chief Executive Officer
MCLEAN, Va.--(BUSINESS WIRE)--TEGNA Inc. appointed Patrick Paolini as the company’s Chief Executive Officer, effective June 1....
-
Getsitecontrol Launches Free Email Quality Checker for Cleaning and Scoring Email Lists
NICOSIA, Cyprus--(BUSINESS WIRE)--Getsitecontrol has launched a free Email Quality Checker that helps analyze and score email contacts before sending campaigns. Designed for marketers working with cold, outdated, or rapidly growing lists, the tool identifies risky email addresses that can negatively affect deliverability and helps brands prioritize higher-quality contacts for segmentation and outreach. The result: cleaner lists, smarter campaigns, better deliverability, and lower costs. "Inbox...
-
I Squared Capital Launches U.S. AI Inference and Edge Colocation Data Center Platform With $1BN Commitment
MIAMI--(BUSINESS WIRE)--I Squared Capital (“I Squared”), a leading global infrastructure investment manager, today announced that it has entered into a definitive Purchase and Sale Agreement to acquire a portfolio of ten data center facilities from Cogent Fiber, LLC, an indirect wholly owned subsidiary of Cogent Communications Holdings, Inc. (NASDAQ: CCOI), for $225 million in cash. The acquisition will seed a new U.S. data center operating platform focused on colocation, high-density deploymen...
-
How Are Canadian Real Estate Professionals Handling the Turbulent 2026 Market?
TORONTO--(BUSINESS WIRE)--A new report from Ownright, Ontario's trusted company for closing real estate transactions, finds that Canada’s housing market is defined by hesitation as buyers and sellers delay decisions amid economic uncertainty. The Ownright Operators Report, based on responses from more than 1,000 real estate professionals across Canada, examines how economic uncertainty is impacting deal activity and how the real estate industry is adapting to consumer sentiment. The findings sh...

-
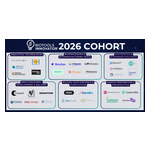
BioTools Innovator 2026 Cohort Includes Top 30 Life Science Tools and Diagnostics Companies
LOS ANGELES--(BUSINESS WIRE)--BioTools Innovator selected 30 life science startups for its 2026 Accelerator, with companies competing for $300K in funding....