

Newsroom
Sorted by: Latest
-
APOLLO Becomes RentCafe’s Preferred Tenant Insurance Partner in Canada
TORONTO--(BUSINESS WIRE)--APOLLO Insurance, a Canadian provider of digital-first insurance products and an innovator in embedded insurance, has expanded its partnership with Yardi® to become the preferred tenant insurance provider for RentCafe in Canada. This expanded collaboration embeds tenant insurance directly into the RentCafe leasing workflow, helping property managers streamline insurance compliance while delivering a seamless experience for residents. Through this enhanced integration,...
-
T-Mobile Raises the Bar, Increasing Its Multi-Year Growth Outlook, Fueled by Widening and Durable Differentiation Across America’s Best Network, Best Value, and Best Customer Experiences With Unparalleled Growth Opportunities
NEW YORK--(BUSINESS WIRE)--During its fourth quarter 2025 earnings call and Capital Markets Day Update event today, T-Mobile US, Inc. (NASDAQ: TMUS) provided an update to its ambitious multi-year plan originally shared at its September 2024 Capital Markets Day, and raised the bar. Srini Gopalan, T-Mobile’s CEO, discussed the Un-carrier’s widening and durable differentiation across its Best Network, Best Value, and Best Experiences, driving unparalleled growth opportunities in its core wireless,...
-
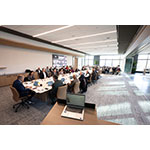
January 2026 Meeting: Port Commission Hosts First Meeting in New Port Administration Building, Highlights 2025 Achievements
HOUSTON--(BUSINESS WIRE)--On Tuesday, January 27, the Port Commission of the Port of Houston Authority met for its first meeting of the year. The meeting was held at the new Port Administration Building, located in Houston’s historic Fifth Ward and bringing Port Houston closer to its earliest roots. Chairman Ric Campo opened the meeting by sharing that all terminals have returned to normal operations following Winter Storm Fern, expressing appreciation to Port Houston staff and industry partner...
-
Umm Al Qura for Development & Construction Company sluit deelname aan het Real Estate Future Forum 2026 af
Riyad, Saoedi-Arabië--(BUSINESS WIRE)--Umm Al Qura for Development & Construction Company, eigenaar, ontwikkelaar en exploitant van de Masar-bestemming in Mekka, heeft haar deelname als strategische partner aan het Real Estate Forum (RFF) van dit jaar afgerond. Het forum vond van 26 tot en met 28 januari plaats in Riyad, onder het patronaat van Zijne Excellentie, de minister van Gemeentelijke en Plattelandszaken en Huisvesting, de heer Majid bin Abdullah Al-Hogail. Het paviljoen van het bed...

-
Umm Al Qura for Development & Construction Company conclude la partecipazione al Real Estate Future Forum 2026
Riad, Arabia Saudita--(BUSINESS WIRE)--Umm Al Qura for Development & Construction Company, società proprietaria, responsabile dello sviluppo e della gestione di Masar Destination a La Mecca, ha concluso la sua partecipazione in qualità di partner strategico al Real Estate Forum (RFF) di quest'anno. Il forum si è tenuto a Riad dal 26 al 28 gennaio sotto il patrocinio di Sua Eccellenza, il Ministro degli Affari municipali rurali e dell'edilizia residenziale, Majid bin Abdullah Al-Hogail. Il p...

-
Ingo Payments Partners with Elektra USA, Powering Instant Account Funding for U.S. Customers
ALPHARETTA, Ga.--(BUSINESS WIRE)--Ingo Payments, a leading provider of embedded banking and money mobility solutions, announced today a new partnership with Elektra USA, the financial technology company behind the Elektra Go app. By leveraging Ingo’s instant account funding solution, Elektra USA will enable its U.S.-based customers to fund their Elektra Go accounts in real time. Elektra USA, committed to delivering secure, convenient, and cost-effective financial services to the Hispanic commun...
-
Abrams Capital, Durable Capital Partners, and Foxhaven Join Greenoaks and Altimeter in Legal Effort to End Korea’s Discrimination Against U.S. Companies and Uphold U.S.-Korea Trade Commitments
SAN FRANCISCO--(BUSINESS WIRE)--Abrams Capital, Durable Capital Partners, and Foxhaven have joined Greenoaks and Altimeter’s (together, the “U.S. Investors”) legal challenge against the Government of the Republic of Korea (the “ROK Government”) to stop Korea’s discriminatory treatment against Coupang, Inc. (NYSE: CPNG) and other U.S. companies. As previously announced, Greenoaks and Altimeter formally notified the ROK Government of their intent to file arbitration claims under the U.S.-Korea Fr...
-
Merz Aesthetics Celebrates 15 Years of XEOMIN® (incobotulinumtoxinA) in the U.S. with One Year of Free Treatments Sweepstakes & New Campaign
RALEIGH, N.C.--(BUSINESS WIRE)--Merz Aesthetics Celebrates 15 Years of XEOMIN® (incobotulinumtoxinA) in the U.S. with One Year of Free Treatments Sweepstakes & New Campaign...
-
Founders Behind $200M EV Infrastructure Exit Launch Start Holdings LLC, an AI-Native Venture Studio to Build Enterprise Software
NEW YORK--(BUSINESS WIRE)--Start Holdings LLC today announced the launch of Start.vc, a venture studio building companies in AI, SaaS, Infrastructure, and enterprise software....

-
Best's Review Looks at How Insurance Education Is Evolving
OLDWICK, N.J.--(BUSINESS WIRE)--In its February Issue, Best’s Review asks industry professionals how academic institutions can better prepare tomorrow’s insurance workforce. In their responses, leaders say they need their employees to develop better communication skills; adapt to the emerging technologies that have entered the insurance space, such as AI; and develop critical thinking skills to ensure a tight grasp of the intricacies of insurance. Read “Learning Curve: Our Readers Identify Gaps...