

Newsroom
Sorted by: Latest
-
Riassunto: SLB annuncia i risultati finanziari del secondo trimestre 2026
LONDRA--(BUSINESS WIRE)--SLB (NYSE: SLB) oggi ha annunciato i risultati finanziari per il secondo trimestre 2026. Il testo originale del presente annuncio, redatto nella lingua di partenza, è la versione ufficiale che fa fede. Le traduzioni sono offerte unicamente per comodità del lettore e devono rinviare al testo in lingua originale, che è l'unico giuridicamente valido....

-
Mobix Labs tekent definitieve overeenkomst voor de overname van Vision Aerial en geeft een impuls aan het wereldwijde droneplatform voor nationale veiligheid en luchtinlichtingen
IRVINE, Calif.--(BUSINESS WIRE)--Mobix Labs, Inc. (Nasdaq: MOBX) maakt vandaag bekend dat het een definitieve overeenkomst heeft gesloten voor de overname van Vision Aerial, Inc., een in de VS gevestigde ontwerper en fabrikant van in de VS gebouwde onbemande vliegtuigsystemen die voldoen aan de National Defense Authorization Act (NDAA, wet inzake de financiering van de nationale defensie). Met deze definitieve overeenkomst gaat de transactie een stap verder dan de eerder aangekondigde intentiev...
-
Mobix Labs sigla l’accordo definitivo per l’acquisizione di Vision Aerial, accelerando lo sviluppo della piattaforma globale di droni per la sicurezza nazionale e l’intelligence aerea
IRVINE, California--(BUSINESS WIRE)--Mobix Labs, Inc. (Nasdaq: MOBX) oggi ha annunciato di avere siglato un accordo definitivo per l’acquisizione di Vision Aerial, Inc., un’impresa statunitense che progetta e produce sistemi aerei a pilotaggio remoto in stabilimenti nazionali e conformi al National Defense Authorization Act (NDAA). L’accordo definitivo porta l’operazione oltre la lettera d’intenti già annunciata e rappresenta un passo fondamentale verso la conclusione di un’acquisizione che con...
-
AM Best Comments on Credit Ratings of Horace Mann Educators Corporation and Its Subsidiaries Following Announced Transaction with Medical Mutual of Ohio
OLDWICK, N.J.--(BUSINESS WIRE)--AM Best has commented that the Credit Ratings (ratings) of Horace Mann Educators Corporation (headquartered in Springfield, IL) and its subsidiaries remain unchanged following the announcement of its transaction with Medical Mutual of Ohio to acquire Employee Services, LLC (ESI) and Reserve National Insurance Company (RNIC). Additionally, Horace Mann will reinsure MedMutual Life Insurance Company’s group life and disability business, while Medical Mutual of Ohio r...
-
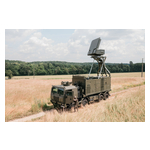
Thales reforzará la protección del espacio aéreo rumano con doce radares Ground Master 200 MM/A
MEUDON, Francia--(BUSINESS WIRE)--En un contexto de creciente colaboración entre naciones europeas para reforzar la seguridad colectiva, la Dirección General de Armamento de Rumania acaba de firmar un acuerdo histórico con la Dirección General de Armamento (DGA) de Francia para la adquisición de doce radares Thales Ground Master 200 Multi-Mission All-in-one (GM200 MM/A). Este acuerdo intergubernamental, financiado por el programa SAFE de la Unión Europea, subraya el alto nivel de colaboración e...
-
Freebirds Is Stuffing More Than Burritos This Summer: Back-to-School Supply Drive is Underway
DALLAS--(BUSINESS WIRE)--Freebirds World Burrito is inviting guests to help local students head back to class fully stocked and ready to learn through its annual Back-to-School Supply Drive, taking place at all Freebirds restaurants now through Friday, August 7.Guests can drop off new, unused school supplies at their favorite Freebirds location, and every donation will go directly to a local school in that restaurant's community.As a thank you for helping fill backpacks, guests who donate can ch...

-
Thales reforçará a proteção do espaço aéreo da Romênia com 12 radares Ground Master 200 MM/A
MEUDON (França)--(BUSINESS WIRE)--Em um contexto de crescente colaboração entre os países europeus para reforçar a segurança coletiva, a Direção-Geral de Armamentos da Romênia acaba de assinar um acordo histórico com a Direction Générale de l’Armement (DGA), da França, para adquirir 12 radares Thales Ground Master 200 Multi-Mission All-in-one (GM200 MM/A). O acordo entre governos, financiado pelo programa SAFE da União Europeia, evidencia o elevado nível da parceria entre a França e a Romênia....

-
Mobix Labs簽署收購Vision Aerial的最終協議,加快打造針對國家安全與空中情報的全球無人機平台
加州爾灣--(BUSINESS WIRE)--(美國商業資訊)-- Mobix Labs, Inc. (Nasdaq: MOBX)今日宣布,公司已簽署收購Vision Aerial, Inc.的最終協議。Vision Aerial總部位於美國,致力於設計並生產美國在地製造、符合《國防授權法案》(NDAA)要求的無人機系統。 最終協議使該交易超越了此前宣布的意向書,代表朝著完成收購邁出關鍵一步。這項收購將協助Mobix Labs進軍全球最重要的技術成長市場之一:用於國家安全、關鍵基礎設施、能源、公共安全、工業檢測和政府營運的安防無人機、自主飛行系統及空中情報領域。 Vision Aerial的客戶和終端用户包括美國空軍、美國海軍、政府機構、能源與公用事業營運商、科研機構,以及其他對效能、可靠性及可信供應鏈有需求的企業。其無人機支援國家安全與公共安全行動、搜尋與救援、森林火災因應、能源與基礎設施巡檢、環境監測、農業、工業製圖以及先進航空感測等任務。 Mobix Labs無人機業務擴張的關鍵一步 該最終協議推動了Mobix Labs的國家安全事務倡議,使公司離打造一個更廣泛的無人機與空中情報...
-
AM Best Assigns Issue Credit Rating to The Travelers Companies, Inc. New Senior Unsecured Notes
OLDWICK, N.J.--(BUSINESS WIRE)--AM Best has assigned a Long-Term Issue Credit Rating of “a+” (Excellent) to $750 million 4.95% senior unsecured notes, due July 2031, issued by the Travelers Companies, Inc. (Travelers) (headquartered in New York, NY). The outlook assigned to this Credit Rating (rating) is stable. The net proceeds of the issuance are expected to be used for general corporate purposes. Through second-quarter 2026, Travelers’ financial leverage ratio is 21.4%, as calculated by AM B...
-
Mobix Labs签署收购Vision Aerial的最终协议,加速打造面向国家安全与空中情报的全球无人机平台
加州尔湾--(BUSINESS WIRE)--(美国商业资讯)-- Mobix Labs, Inc. (Nasdaq: MOBX)今日宣布,公司已签署收购Vision Aerial, Inc.的最终协议。Vision Aerial总部位于美国,致力于设计并生产美国本土制造、符合《国防授权法案》(NDAA)要求的无人机系统。 最终协议使该交易超越了此前宣布的意向书,标志着朝着完成收购迈出关键一步。这项收购将助力Mobix Labs进军全球最重要的技术增长市场之一:用于国家安全、关键基础设施、能源、公共安全、工业检测和政府运营的安防无人机、自主飞行系统及空中情报领域。 Vision Aerial的客户和最终用户包括美国空军、美国海军、政府机构、能源与公用事业运营商、科研机构,以及其他对性能、可靠性及可信供应链有需求的组织。其无人机支持国家安全与公共安全行动、搜索与救援、森林火灾应对、能源与基础设施巡检、环境监测、农业、工业制图以及先进航空传感等任务。 Mobix Labs无人机业务拓展的关键一步 该最终协议推动了Mobix Labs的国家安全事务倡议,使公司离打造一个更广泛的无人机与空中情...