

Newsroom
Sorted by: Latest
-
Binary Defense Names Industry Veteran Rafal Los as Chief Strategy Officer
CLEVELAND--(BUSINESS WIRE)--Binary Defense names cybersecurity veteran Rafal Los Chief Strategy Officer to advance AI-driven MDR, SOC innovation and market strategy....
-
Dealer Pay Joins The Shop by FordDirect as a Preferred Vendor
SAINT CHARLES, Mo.--(BUSINESS WIRE)--Dealer Pay, driven by Vehlo, today announced it has been named a preferred vendor in The Shop by FordDirect, which is a curated marketplace of trusted dealership solutions. Dealer Pay is the first payments solution approved as an endorsed vendor within The Shop. The inclusion of Dealer Pay in FordDirect marks the 27th OEM that Vehlo’s solutions now have a partnership with, highlighting the trust the automotive industry has in the company. Dealer Pay’s status...

-
AST SpaceMobile Announces Launch Date for BlueBird Satellites 11, 12, and 13
MIDLAND, Texas--(BUSINESS WIRE)--AST SpaceMobile, Inc. (“AST SpaceMobile”) (NASDAQ: ASTS), the company building the first and only space-based cellular broadband network accessible directly by everyday smartphones, designed for both commercial and government applications, today announced that the launch of BlueBird 11, 12, and 13 satellites is currently scheduled for Wednesday, August 5, 2026, from Cape Canaveral Space Force Station, Florida, aboard a Falcon 9 rocket. Liftoff is targeted for 3:...

-
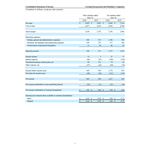
Core Scientific Announces Second Quarter 2026 Results
MIAMI--(BUSINESS WIRE)--Core Scientific, Inc. (NASDAQ: CORZ), a leader in digital infrastructure for high-density colocation services (“HDC”), today announced financial results for the second quarter ended June 30, 2026. Recent Business Developments Announced a partnership with AMD with the potential to support up to 2.5 GW of leasable capacity, anchored by 15-year agreements for approximately 530 MW across five sites and more than $14 billion of potential base contracted revenue. Increased tot...
-
Massachusetts Financial Services Company UK Regulatory Announcement: Form 8.3
LONDON--(BUSINESS WIRE)-- FORM 8.3 PUBLIC OPENING POSITION DISCLOSURE/DEALING DISCLOSURE BY A PERSON WITH INTERESTS IN RELEVANT SECURITIES REPRESENTING 1% OR MORE Rule 8.3 of the Takeover Code (the “Code”) 1. KEY INFORMATION (a) Full name of discloser: Massachusetts Financial Services Company (b) Owner or controller of interests and short positions disclosed, if different from 1(a): The naming of nominee or vehicle companies is insufficient. For a trust, the trustee(s), settlor and beneficiari...
-
Everforth ECS Wins $115M AI Research and Engineering Contract Supporting US Army Nautilus Program
FAIRFAX, Va.--(BUSINESS WIRE)--Everforth ECS Wins $115M AI Research and Engineering Contract Supporting US Army Nautilus Program...
-
Corning’s Strong Second-Quarter 2026 Financial Results(1) Demonstrate Progress on Recently Upgraded Springboard Plan
CORNING, N.Y.--(BUSINESS WIRE)--Corning Incorporated (NYSE: GLW) today announced its second-quarter 2026 results and provided its outlook for third-quarter 2026. News Summary: Year over year, Q2 core sales grew 17% to $4.74 billion. Core EPS grew 30% to $0.78. Optical Communications grew sales 32% to $2.07 billion, including a 65% increase in Enterprise Networks, with Gen AI product sales growing significantly faster. Solar grew sales 90% and completed an extended maintenance shutdown and equip...
-
Promega Achieves 100% Renewable Electricity Across Global Operations
MADISON, Wis.--(BUSINESS WIRE)--Promega is now sourcing 100% renewable electricity across global operations, announced with SBTi-validated targets in its 2026 responsibility report....

-
Core Scientific and AMD Announce Infrastructure Partnership
MIAMI & SANTA CLARA, Calif.--(BUSINESS WIRE)--Core Scientific (NASDAQ: CORZ) and AMD (NASDAQ: AMD) today announced a partnership to shape the future of AI infrastructure, with AMD to secure up to 2.5 gigawatts of data center capacity to support end customer deployments of AMD AI solutions. As part of the agreement, Core Scientific and AMD will collaborate on physical infrastructure design and the deployment of AMD Instinct™ GPUs, EPYC™ CPUs, and ROCm™ software. As AI demand continues to acceler...
-
Octagon Criticizes XFLT Board’s Coercive Plan to Cajole Shareholders into Approving an Unfit Sub-Adviser for the Fund
NEW YORK--(BUSINESS WIRE)--Octagon Credit Investors, LLC (“Octagon,” “we” or “our”), a leading credit-focused asset manager with over 30 years of experience, today responded to the liquidity plan announced by the Board of Trustees (the “Board”) of XAI Floating Rate & Alternative Income Trust (NYSE: XFLT) (formerly, XAI Octagon Floating Rate & Alternative Income Trust) (the “Fund” or “XFLT”), which is conditioned upon the approval of a new sub-advisory agreement (the “New Sub-Adviser Pro...