

Newsroom
Sorted by: Latest
-
Takeda Announces New Assignments of Directors and Appointment of Julie Kim as Representative Director, President and CEO
OSAKA, Japan & CAMBRIDGE, Mass.--(BUSINESS WIRE)--In the final step of its 18-month CEO transition, Takeda (TOKYO:4502/NYSE:TAK) today announced that Julie Kim was officially appointed Takeda’s Representative Director, President and Chief Executive Officer. During the 150th Annual General Meeting of Shareholders, which took place in Osaka, Japan, shareholders elected Julie as a new internal director to the Board of Directors. Following the vote and conclusion of the meeting, the Board of Direct...
-
Signatera™ Receives Regulatory Approval in Japan for Colorectal Cancer
AUSTIN, Texas--(BUSINESS WIRE)--Natera, Inc. (NASDAQ: NTRA), a global leader in cell-free DNA and precision medicine, today announced that Signatera has received regulatory approval from Japan’s Pharmaceuticals and Medical Devices Agency (PMDA). This approval supports the use of Signatera for patients with colorectal cancer (CRC) in the adjuvant setting and makes Signatera the first PMDA-approved MRD test in Japan. Natera expects to commercially launch Signatera for CRC in Japan by the end of 2...
-
Cloudflare und beehiiv führen KI-Crawling-Kontrollen ein, um unabhängigen Verlagen den Einstieg in das KI-Zeitalter zu erleichtern
SAN FRANCISCO--(BUSINESS WIRE)--Cloudflare, Inc. (NYSE: NET), das führende Cloud-Unternehmen im Bereich Konnektivität, und beehiiv, die auf Newsletter ausgerichtete Publishing-Plattform, die Verlagen und Unternehmen dabei hilft, ihre Zielgruppe zu gewinnen, auszubauen und zu monetarisieren, gaben heute eine strategische Partnerschaft bekannt, um die Creator-Economy neu zu definieren und die Art und Weise zu verändern, wie unabhängige Kreative mit KI interagieren. Durch die direkte Integration d...
-
大腸がんを対象に、Signatera診断システムTMが薬事承認を取得
テキサス州オースティン、--(BUSINESS WIRE)--(ビジネスワイヤ) -- セルフリーDNAおよびプレシジョン・メディシン(個別化医療)のグローバルリーダーであるNatera, Inc. (NASDAQ: NTRA) は本日、Signateraが本邦における薬事承認を取得したことを発表しました。 今回の承認は手術後の結腸・直腸がん(大腸がん)患者に対するSignatera診断システムTMの使用を認めるものであり、日本初の薬事承認されたMRD検査となります。今後Nateraは、保険収載を経て、2026年末までに日本で結腸・直腸がん患者を対象としたSignatera診断システムTMを販売開始する予定です。結腸・直腸がんは、日本国内で毎年15万人以上の患者さんが診断される国内で最も多いがんの一つで、その罹患患者数は米国と同等です。Signatera診断システムTMの承認は、日本の臨床医が術後補助治療の決定を行う際の新たな個別化された検査としてそのアンメットニーズを満たすことになります。 結腸・直腸がんにおけるMRD検査は、日本癌治療学会(JSCO)からの見解書および日本臨床腫瘍...
-
Forrester: Nine In 10 US Marketing Agencies Use AI To Cut Costs At The Expense Of Creativity
CANNES, France & CAMBRIDGE, Mass.--(BUSINESS WIRE)--According to Forrester’s (Nasdaq: FORR) The State Of AI Inside US Marketing Agencies, 2026, a new report released today in partnership with 4As, AI is now pervasive across US marketing agencies: Nine in 10 agencies use generative AI, and half use agentic AI for marketing execution. Yet rapid adoption, combined with an industrywide focus on productivity and cost efficiency, is undermining marketing effectiveness, creativity, and long-term brand...

-
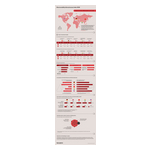
Electromobility at a tipping point
AMSTERDAM--(BUSINESS WIRE)--Global electromobility is at a critical turning point. Battery electric vehicles (BEVs) are becoming significantly more attractive worldwide, driven in part by rising fuel prices and a much broader range of available models. But their breakthrough does not only depend on demand for new cars. This is highlighted by the BearingPoint E-Mobility Attractiveness Index 2026, for which more than 10,000 consumers in Germany, the United Kingdom, the United States, China, and I...
-
Thredd在亚太地区推出Visa Cloud Connect Live,助力该地区实现更快、更可靠的发卡服务
新加坡--(BUSINESS WIRE)--(美国商业资讯)-- 以人工智能为核心的发卡机构处理平台Thredd今日宣布,已在亚太地区部署Visa Cloud Connect(VCC),这标志着该公司更广泛的云转型战略在该地区迈出了重要一步。 继Thredd达成启用Visa Cloud Connect的全球协议之后,此次在亚太地区的落地实施进一步彰显了公司致力于为该地区运营的金融科技公司、数字银行和嵌入式金融服务提供商构建更具韧性、可扩展且面向未来的发卡基础设施。该实施项目目前通过Thredd的亚太区域云枢纽——新加坡进行集中管理,从而为客户带来更快的项目接入速度、更高效的发布周期以及更高的运营可靠性。 Visa Cloud Connect使企业能够通过基于云的基础设施接入Visa的安全全球支付网络VisaNet。对于Thredd而言,此次部署是其从传统数据中心硬件向端到端云原生基础设施转型的一部分,其中包括直接通过云端连接至该网络。这减少了对第三方中介的依赖,并使Thredd能够更好地掌控其平台的性能、监控和弹性。 Thredd亚太区负责人Damien Gough表示,“Visa C...
-
Thredd於亞太地區正式啟用Visa Cloud Connect,支援區域內更快速、更可靠的發卡服務
新加坡--(BUSINESS WIRE)--(美國商業資訊)-- AI優先的發卡處理平台Thredd今日宣布在亞太地區實施Visa Cloud Connect(VCC),這標誌著該公司在更廣泛的雲端轉型策略中,達成了本地區的重要里程碑。 繼Thredd達成啟用Visa Cloud Connect的全球協議之後,此次在亞太地區的實施,進一步體現了該公司致力於為該地區的金融科技公司、數位銀行和嵌入式金融服務商,打造更具韌性、可擴展性且面向未來的發卡基礎架構。該實施目前集中於Thredd的亞太地區雲端樞紐-新加坡,為客戶協助更快的專案上線、更高效的發布週期以及強化的營運可靠性。 Visa Cloud Connect讓企業能夠透過雲端基礎設施存取Visa的安全全球支付網路VisaNet。對Thredd而言,此次實施是其從傳統資料中心硬體轉向端到端雲端原生基礎設施(包括直接與該網路建立雲端連線)之更廣泛轉型的一部分。這減少了對第三方中介機構的依賴,並讓Thredd更有效掌控其平台的效能、監控和韌性。 Thredd亞太地區負責人Damien Gough表示:「Visa Cloud Connect代...
-
Deutsche Bank, Swift and Financial Institutions Worldwide Team up to Deliver a New Era of International Money Transfers to Germany
FRANKFURT, Germany--(BUSINESS WIRE)--People in Germany receiving money from family, friends or businesses abroad will get a significantly better experience as Deutsche Bank goes live with a new consumer payments initiative from Swift, the organisation behind the global network that connects more than 11,500 financial institutions in over 200 markets, which is enabling international payments to reach the end customer’s account in a matter of seconds. The initiative sets a new standard for intern...
-
Die Deutsche Bank, SWIFT und Finanzinstitute weltweit schließen sich zusammen, um eine neue Ära internationaler Geldüberweisungen nach Deutschland einzuläuten
FRANKFURT, Deutschland--(BUSINESS WIRE)--Personen in Deutschland, die Geld von Familienangehörigen, Freunden oder Unternehmen im Ausland erhalten, werden von einer deutlich verbesserten Abwicklung profitieren, da die Deutsche Bank eine neue Initiative für Privatkundenzahlungen von SWIFT in Betrieb nimmt. SWIFT ist die Organisation hinter dem globalen Netzwerk, das mehr als 11.500 Finanzinstitute in über 200 Märkten miteinander verbindet und es ermöglicht, dass internationale Zahlungen innerhalb...