

Newsroom
Sorted by: Latest
-
DEWA International è stata costituita come società controllata interamente indipendente da DEWA con l'obiettivo di sviluppare progetti globali nel settore energetico e idrico
Dubai, Emirati Arabi Uniti--(BUSINESS WIRE)--Sua Altezza lo Sceicco Ahmed bin Saeed Al Maktoum, presidente del Consiglio Supremo per l'Energia di Dubai, ha annunciato la costituzione di "DEWA International", una controllata interamente indipendente della Dubai Electricity and Water Authority (DEWA). La società mira a sviluppare progetti nel settore dell'energia convenzionale e pulita in tutto il mondo e a esportare il modello di successo di Dubai in materia di infrastrutture energetiche e idric...

-
DEWA International is opgericht als een volledige onafhankelijke dochteronderneming van DEWA om wereldwijde energie- en waterprojecten te ontwikkelen
Dubai, Verenigde Arabische Emiraten--(BUSINESS WIRE)--Zijne Hoogheid Sheikh Ahmed bin Saeed Al Maktoum, voorzitter van de Dubai Supreme Council of Energy, heeft de oprichting aangekondigd van 'DEWA International', een volledig onafhankelijke dochteronderneming van de Dubai Electricity and Water Authority (DEWA). Het bedrijf wil wereldwijd conventionele en schone energieprojecten ontwikkelen en het succesvolle energie- en waterinfrastructuurmodel van Dubai exporteren naar wereldwijde markten. Zi...

-
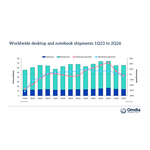
Omdia:全球PCPC市場在供應壓力加劇的背景下於2026年第二季下滑4%
倫敦--(BUSINESS WIRE)--(美國商業資訊)-- Omdia最新研究指出,全球桌上型電腦、筆記型電腦和工作站的出貨量於2026年第二季較去年同期衰減3.6%至6570萬台。桌上型電腦(含桌上型工作站)出貨量為1390萬台,較去年同期下降1.3%;筆記型電腦(含行動工作站)出貨量為5170萬台,較去年同期下降4.2%。 「記憶體和儲存價格在今年第一季急劇上漲,對第二季的產品定價造成顯著的影響。」Omdia首席分析師(Principal Analyst)Ben Yeh說,「這個現象也促使消費者和資科決策者提前購買PC,以避免未來價格進一步上揚的風險。儘管銷售量保持穩定,但市場繼續下滑的風險仍然存在。」 Apple最近決定上調MacBook系列所有產品的售價,成為市場關注的重要話題。然而,其他PC廠商早在2025年第四季末便已開始漲價,並持續按季度調整價格。同類產品線的價格較去年同期上漲了20%至40%。 「繼上半年出現需求提前釋出的現象之後,供應吃緊的具體作用逐漸浮現,目前的跡象顯示市場將有一段時間處於需求遞延的狀態。」Omdia研究主任Ishan Dutt說,「Omdia在...
-
FM and PURE Insurance Partner to Strengthen Loss Prevention for High-Value Homes
JOHNSTON, R.I. & WHITE PLAINS, N.Y.--(BUSINESS WIRE)--FM, a leading commercial property insurer known for its science- and engineering-led approach to risk management, and PURE Insurance (PURE), the reciprocal insurer exclusively serving high-net-worth families across the United States and Canada, today announced a strategic partnership, expanding FM’s leading loss prevention capabilities to protect high-value residential homes. The partnership establishes a long-term collaboration to bring FM’...
-
DEWA International est lancée en tant que filiale indépendante détenue à 100 % par DEWA pour développer des projets énergétiques et hydrauliques à l'échelle mondiale
Dubaï, Émirats arabes unis--(BUSINESS WIRE)--Son Altesse Cheikh Ahmed bin Saeed Al Maktoum, président du Conseil suprême de l'énergie de Dubaï, a annoncé la création de 'DEWA International', une filiale indépendante détenue à 100 % par la Dubai Electricity and Water Authority (DEWA). Cette nouvelle société a pour objectif de développer des projets d'énergie conventionnelle et propre à travers le monde, tout en exportant vers les marchés internationaux le modèle éprouvé de Dubaï en matière d'inf...

-
ABL Diagnostics : Cession d'un nouveau bloc d'actions par son actionnaire principal ABL
WOIPPY, France--(BUSINESS WIRE)--Regulatory News: ABL Diagnostics (Paris:ABLD) informe que son actionnaire principal, Advanced Biological Laboratories (ABL), une société de diagnostic luxembourgeoise, a déposé, via ONDE, le dispositif centralisé de dépôt des informations auprès de l’Autorité des marchés financiers (AMF), une information relative à la cession d'un nouveau bloc d'actions ABL Diagnostics dans le cadre d'une opération de gré à gré avec un tiers privé. Le dépôt relatif à cette cessi...
-
HSBC Bank Plc UK Regulatory Announcement: FRN Variable Rate Fix
LONDON--(BUSINESS WIRE)-- 08-July-2026 Issue: Mitsubishi HC Capital UK Plc Series 951 XS3142525354 Pursuant to our appointment as Agent for the above stated issue, please be advised of the following interest rate determination: Date From: 14-April-2026 Date To: 14-July-2026 Record Date: 13-July-2026 Value Date: 14-July-2026 Benchmark Rate: 3.63269% Margin: 0.5% Total Rate: 4.13269% Floor: 0% Number of Days: 91 Day Count: Actual / 360 Interest Frequency: Quarterly Total Amount Due: USD 417,860....
-
SureWerx Appoints Erik Pertot as VP/GM SureWerx EMEA
CHICAGO--(BUSINESS WIRE)--SureWerx, a leading global manufacturer of personal protective equipment, safety products, tools and equipment solutions, today announced the appointment of Erik Pertot as VP/GM SureWerx EMEA. Pertot will report directly to CEO Scott Dowell and will lead growth, manufacturing and M&A activities in Europe across the company’s global portfolio. Erik joins SureWerx with more than 20 years of international leadership experience across engineering, quality, marketing, s...
-
ABL Diagnostics: Sale of a New Block of Shares by Its Main Shareholder ABL
WOIPPY, France--(BUSINESS WIRE)--Regulatory News: ABL Diagnostics (Paris:ABLD) announces that its main shareholder, Advanced Biological Laboratories (ABL), a Luxembourg-based diagnostics company, has filed information with the French Financial Markets Authority (AMF) via ONDE, the centralized information filing system, regarding the sale of a new block of ABL Diagnostics shares as part of an over-the-counter transaction with a private third party. The filing relating to this sale can be viewed...
-
HSBC Bank Plc UK Regulatory Announcement: FRN Variable Rate Fix
LONDON--(BUSINESS WIRE)-- 09-July-2026 Issue: Bank of Montréal Series 374 XS2798993858 Pursuant to our appointment as Agent for the above stated issue, please be advised of the following interest rate determination: Date From: 13-July-2026 Date To: 13-October-2026 Record Date: 12-October-2026 Value Date: 13-October-2026 Benchmark Rate: 2.378% Margin: 0.47% Total Rate: 2.848% Floor: 0% Number of Days: 92 Day Count: Actual / 360 Interest Frequency: Quarterly Denomination: EUR 1,000.00 Amount per...