

Newsroom
Sorted by: Latest
-
Echodyne opent grote nieuwe productiefaciliteit om te voldoen aan snelgroeiende wereldwijde vraag
KIRKLAND, Wash.--(BUSINESS WIRE)--Echodyne, het radarplatformbedrijf, kondigt vandaag een grote uitbreiding van zijn productiecapaciteit voor geavanceerde radars aan. De nieuwe faciliteit van Echodyne, met een oppervlakte van 86.350 vierkante voet (ongeveer 8.000 vierkante meter), biedt voldoende productie- en opslagruimte om meer dan 30.000 radars per jaar te produceren en te verzenden. De modulaire productieaanpak van het bedrijf maakt het mogelijk de productiecapaciteit aan te passen aan de...
-
Resecurity Dominates at the World Defense Show 2026 in Saudi Arabia with Cyber Intelligence and ISR Solutions
LOS ANGELES--(BUSINESS WIRE)--Resecurity (USA), a global cybersecurity provider protecting Fortune 100 companies and government agencies worldwide, is proud to exhibit at the World Defense Show (WDS) 2026, taking place from February 8 to 12, 2026, in the Kingdom of Saudi Arabia. World Defense Show is a major international defense exhibition held under the Royal Patronage of the Custodian of the Two Holy Mosques, King Salman bin Abdulaziz Al Saud. Delivering an array of enhanced show features, W...
-
QURE Investors Have Opportunity to Lead uniQure N.V. Securities Fraud Lawsuit with the Schall Law Firm
LOS ANGELES--(BUSINESS WIRE)--QURE Investors Have Opportunity to Lead uniQure N.V. Securities Fraud Lawsuit with the Schall Law Firm...
-
INNIO 、VoltaGridから1.5GWのビハインド・ザ・メーター発電設備を追加受注
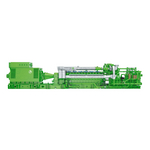
イェンバッハ(オーストリア)&ヒューストン--(BUSINESS WIRE)--(ビジネスワイヤ) -- INNIOグループは、VoltaGridから1.5ギガワット(GW)規模の大型発注を受けたことを発表しました。これにより、AIおよび高性能コンピューティングインフラ向けのビハインド・ザ・メーター(オンサイト)発電に関する両社の提携が強化されます。 この契約では、INNIOはJ624型およびJ620型シリーズのJenbacherガスエンジンを合計300台供給する予定です。J624シリーズは、VoltaGrid独自のQPac™プラットフォームに統合されます。これらのエンジンは25メガワット(MW)のユニットにパッケージ化されており、米国全土のデータセンター顧客への迅速かつスケーラブルな導入が可能になります。納入は2028年まで続く予定です。 INNIOグループの社長兼CEOであるオラフ・バーリエンは、「この重要な受注は、INNIOの技術力と、AIの成長を促進するという当社のコミットメントを改めて示すもので、当社がエネルギーインフラの進化に貢献する中で、VoltaGridとの提携を深め...

-
'Just Use It!' AHF Celebrates International Condom Day
LOS ANGELES--(BUSINESS WIRE)--'Just Use It!' AHF Celebrates International Condom Day...
-
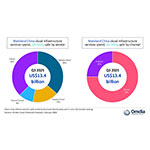
Omdia:2025年第三季度中國大陸雲端基礎設施市場加速成長至24%
倫敦--(BUSINESS WIRE)--(美國商業資訊)-- 根據Omdia數據,2025年第三季度中國大陸雲端基礎設施服務市場規模達134億美元,年增長率為24%。這已是連續第二季度增速超過20%。持續的AI需求不僅驅動市場採用,更對核心雲端基礎設施服務產生帶動效應,加速雲端資源消耗向生產工作負載轉移。對此,主要雲端服務商持續擴展AI能力,同時更重視模型產品化與角色分化,並強化支持AI代理平台的工具鏈與平台能力。2025年第三季度,阿里巴巴雲、華為雲及騰訊雲的市佔率分別為36%、16%與9%。 2025年第三季度,中國大陸雲端基礎設施服務市場持續復甦,年增長率達24%。隨著企業從早期AI試驗邁向更廣泛的應用,AI日益成為核心雲基礎設施服務新增需求的主要驅動力,帶動計算、存儲及資料庫等資源消耗增長「隨著AI應用深化,領先雲端廠商除了持續提升基礎模型能力,更將這些模型定位為廣泛平台架構中的功能組件。」Omdia資深總監Rachel Brindley表示,「更清晰的角色定義與更緊密的平台整合,正成為日益重要的焦點。」本季度,阿里巴巴雲擴展了其多模態模型產品組合;華為雲透過聯合發布產業模型...
-
INNIO reçoit une nouvelle commande majeure de VoltaGrid pour 1,5 GW de production d'électricité derrière le compteur
JENBACH, Autriche et HOUSTON--(BUSINESS WIRE)--Le groupe INNIO annonce aujourd’hui une commande majeure de VoltaGrid pour 1,5 gigawatts (GW), renforçant la collaboration des entreprises dans la production d'électricité derrière le compteur (sur site) pour les infrastructures d’IA et de calcul haute performance. En vertu de l'accord, INNIO prévoit de fournir un total de 300 moteurs à gaz Jenbacher de ses séries Type J624 et Type J620. La série J624 est intégrée à la plateforme QPac™ propriétaire...

-
Samenvatting: INNIO verzekert een extra grote order van VoltaGrid: 1,5 GW voor BTM (behind-the-meter) stroomopwekking
JENBACH, Oostenrijk & HOUSTON--(BUSINESS WIRE)--INNIO Group maakte vandaag een grote order van VoltaGrid bekend voor 1,5 GW (gigawatt). Deze order versterkt de samenwerking tussen de bedrijven voor BTM (behind‑the‑meter) stroomopwekking (ter plaatse) voor AI- en sterk presterende rekeninfrastructuur. In het kader van het akkoord verwacht INNIO om in totaal 300 Jenbacher gasmotoren van haar Type J624- en Type J620-serie aan te leveren. De J624-serie is geïntegreerd in het eigen QPac™-platform va...
-
Riassunto: INNIO si assicura un altro importante ordine da parte di VoltaGrid: 1,5 GW per la generazione di energia dietro il contatore
JENBACH, Austria e HOUSTON--(BUSINESS WIRE)--INNIO Group oggi ha annunciato un'importante commessa di 1,5 gigawatt (GW) da parte di VoltaGrid, rafforzando la collaborazione tra le aziende nella generazione di energia dietro il contatore (in sede) per infrastrutture di IA e di calcolo ad alte prestazioni. L'accordo prevede la fornitura da parte di INNIO di un totale di 300 motori a gas Jenbacher delle sue serie Tipo J624 e Tipo J620. La serie J624 è integrata nella piattaforma proprietaria QPac™...

-
Echodyne將新開設一家大型製造工廠,以滿足快速成長的全球需求
華盛頓州柯克蘭--(BUSINESS WIRE)--(美國商業資訊)-- 雷達平台公司Echodyne今天宣布,其先進雷達產能將在近期內大幅擴張。 Echodyne的新建86,350平方英尺工廠將提供充足的製造和倉儲空間,每年可生產並交付超過30,000部雷達。公司採用模組化製造模式,產能可靈活調整,以滿足不同產品線的需求變化,並能夠無縫引入新的產品線和功能。此次投資體現了Echodyne一如既往的承諾:隨著無人系統在戰場及社會各領域日益普及,我們必須強化安全防護措施,以因應美國及全球盟友與日俱增的需求,並鞏固美國的國防工業基礎。 反無人飛行器系統(C-UAS)、超視距(BVLOS)緊急應變無人機(DFR)作戰、部隊防護、邊境安全以及移動偵察(OTM)等應用和能力,正推動著對高解析度空域和水面監視雷達的需求加速成長。公司擁有專利超材料電子掃描陣列(MESA®)技術,可在緊湊型固態雷達產品中實現無與倫比的資料保真度——精準定位、追蹤穩定性、基於人工智慧的威脅分類,以及便於整合到系統之系統中的高速應用程式介面(API)。 Echodyne執行長Eben Frankenberg評論道: 「在...