Newsroom
Sorted by: Latest
-
Resumen: Epicor Prism se lanza en los mercados europeos, ofreciendo a los fabricantes IA integrada y específica para cada sector
LONDRES--(BUSINESS WIRE)--Epicor ha ampliado su estrategia de ERP con tecnología de IA en el Reino Unido y en determinados mercados europeos con el lanzamiento general de Epicor Prism, una gama de agentes de IA verticales diseñados específicamente para los sectores relacionados con la cadena de suministro. Integrado directamente en Epicor Kinetic, Epicor Prism ofrece a los clientes acceso conversacional a datos de ERP en tiempo real y a documentos relacionados sin necesidad de contar con conoci...
-
Riassunto: Epicor Prism debutta sui mercati europei e offre ai produttori l'AI integrata e specifica per settore
LONDRA--(BUSINESS WIRE)--Epicor estende la propria strategia ERP basata sull'AI nel Regno Unito e in selezionati mercati europei con la disponibilità generale di Epicor Prism, un portfolio di agenti AI verticali creati ad hoc per il settore della supply chain. Incorporato direttamente in Epicor Kinetic, Epicor Prism offre ai clienti l'accesso conversazionale ai dati ERP e ai documenti correlati in tempo reale, senza necessità di abilità analitiche specializzate né di strumenti AI separati. Il l...
-
Samenvatting: Epicor Prism wordt gelanceerd op de Europese markten om fabrikanten ingebedde, sectorspecifieke AI aan te bieden
LONDEN--(BUSINESS WIRE)--Epicor heeft zijn AI-gedreven ERP-strategie in de UK en een selectie Europese markten uitgebreid met de algemene beschikbaarheid van Epicor Prism, een portfolio verticale AI agents die specifiek voor de industrieën van de toeleveringsketen zijn ontworpen. Epicor Prism is rechtstreeks in Epicor Kinetic ingebed en biedt klanten conversationele toegang tot live ERP-data en aanverwante documenten zonder dat hiervoor gespecialiseerde analytische vaardigheden of aparte AI-too...
-
Epicor Prism est lancé sur les marchés européens, offrant aux fabricants une IA intégrée et adaptée à leur secteur d'activité
LONDRES--(BUSINESS WIRE)--Epicor a étendu sa stratégie ERP basée sur l’IA au Royaume-Uni et sur certains marchés européens avec la mise à disposition générale d’Epicor Prism, une gamme d’agents IA verticaux spécialement conçus spécialement pour les industries de la chaîne d’approvisionnement. Intégré directement à Epicor Kinetic, Epicor Prism offre aux clients un accès conversationnel aux données ERP en temps réel et aux documents associés, sans nécessiter de compétences analytiques spécialisée...
-
Epicor Prism wird auf den europäischen Märkten eingeführt und bietet Herstellern integrierte, branchenspezifische KI-Funktionen
LONDON--(BUSINESS WIRE)--Epicor hat seine KI-gestützte ERP-Strategie in Großbritannien und ausgewählten europäischen Märkten durch die allgemeine Verfügbarkeit von „Epicor Prism“ erweitert, einem Portfolio branchenbezogener KI-Agenten, die speziell für die Lieferkettenbranche entwickelt wurden. Epicor Prism ist direkt in Epicor Kinetic integriert und bietet Kunden einen dialogorientierten Zugriff auf aktuelle ERP-Daten und zugehörige Dokumente, ohne dass spezielle Analysekenntnisse oder separat...
-
Asana Achieves FedRAMP® Moderate Authorization for Asana Gov
SAN FRANCISCO--(BUSINESS WIRE)--Asana, Inc. (NYSE: ASAN) (LTSE: ASAN) announced today that Asana Gov has achieved FedRAMP® Moderate Authorization, enabling public sector organizations to coordinate critical initiatives and core operations with greater clarity, accountability, and visibility across programs while meeting federal security and compliance requirements.The authorization marks an important milestone in Asana's commitment to the public sector and reflects years of investment in meeting...
-
North and Latin American Partners Honored at Engage 2026 for Driving AI Business Outcomes
LAS VEGAS--(BUSINESS WIRE)--ENGAGE 2026 — Verint® honored its partners across North and Latin America during Engage 2026 in Las Vegas. The Engage Partner Awards winners were recognized for their role in helping organizations operationalize AI in the contact center. For many organizations, AI in the contact center remains stuck in pilots and early deployments. The Engage Partner Award winners help customers move beyond experimentation, embedding AI into daily environments and delivering measurab...
-
The Trust Threshold: The Majority of U.S. Investors Use AI To Explore, But Only 7% Say It Drove Their Last Major Decision
NEW YORK--(BUSINESS WIRE)--AI has become a mainstream tool for U.S. investors to research finance and investing topics, but when it comes to making a decision, they turn to trusted human advisors for judgment, context, and conviction. These findings come from a new survey, commissioned by HSBC from Ipsos Asia Limited, of almost 10,000 affluent and high-net-worth individuals across 10 markets, including over 1,000 in the U.S., exploring how individuals use AI in finance and investment decision-m...
-
Worthington Steel Declares Quarterly Dividend
COLUMBUS, Ohio--(BUSINESS WIRE)--The board of directors of Worthington Steel, Inc. (NYSE: WS) has declared a quarterly dividend of $0.16 per common share....
-
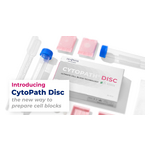
StatLab lancia CytoPath Disc e promuove la preparazione standardizzata dei citoinclusi in tutto il mondo
MCKINNEY, Texas--(BUSINESS WIRE)--StatLab Medical Products, azienda leader a livello mondiale nello sviluppo e nella produzione di strumenti, reagenti e consumabili per il laboratorio, ha annunciato oggi il lancio globale di CytoPath Disc, un’innovativa tecnologia per la preparazione di citoinclusi progettata per standardizzare e semplificare tale processo. Sviluppato come alternativa ai tradizionali metodi di citoinclusione, che trasformano materiale cellulare sospeso in un fluido in un format...