Newsroom
Sorted by: Latest
-
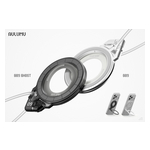
AULUMU erweitert die G09-Serie mit dem transparenten G09 Ghost Magnetic Stand
SHENZHEN, China--(BUSINESS WIRE)--Die auf Design ausgerichtete Technologie-Zubehörmarke aulumu hat ihre G09-Serie um den „G09 Ghost Transparent Infinite 360° Magnetic Stand“ erweitert. Das neue Modell ergänzt das ursprüngliche G09-Modell aus Aluminium und bietet zwei unterschiedliche Ausführungen, wobei das Konzept des magnetischen Halters mit mehreren Neigungswinkeln beibehalten wird. Beide G09-Modelle verfügen über einen dreiachsigen Mechanismus, der unabhängige Bewegungen entlang der X-, Y-...

-
AULUMU Expands the G09 Series with the Transparent G09 Ghost Magnetic Stand
SHENZHEN, China--(BUSINESS WIRE)--Design-focused technology accessories brand aulumu has expanded its G09 Series with the G09 Ghost Transparent Infinite 360° Magnetic Stand. The new model joins the original aluminium G09, offering two distinct constructions while retaining the same multi-angle magnetic stand concept. Both G09 models use a three-axis mechanism that allows independent movement across the X, Y and Z axes. This enables users to position a smartphone in portrait, landscape, elevated...
-
Hawaiian Electric Seeks to Expand Renewables, Energy Storage on Oʻahu, Hawaiʻi Island and Maui
HONOLULU--(BUSINESS WIRE)--Hawaiian Electric Company, Inc. (Hawaiian Electric), a subsidiary of Hawaiian Electric Industries, Inc. (HEI) (NYSE - HE), today submitted its Integrated Grid Planning Request for Proposals (IGP RFP), seeking plans for competitively priced renewable energy and storage for Oʻahu, Hawaiʻi Island and Maui to meet customers’ growing energy needs and modernize the generation fleet to drive down costs by reducing the use of oil for power generation. Collectively, these proj...

-
DSGR Investors Have the Opportunity to Join Investigation of Distribution Solutions Group, Inc. with the Schall Law Firm
LOS ANGELES--(BUSINESS WIRE)--DSGR Investors Have the Opportunity to Join Investigation of Distribution Solutions Group, Inc. with the Schall Law Firm...
-
FSUN Investors Have Opportunity to Join FirstSun Capital Bancorp Fraud Investigation with the Schall Law Firm
LOS ANGELES--(BUSINESS WIRE)--FSUN Investors Have Opportunity to Join FirstSun Capital Bancorp Fraud Investigation with the Schall Law Firm...
-
REGN Investors Have Opportunity to Lead Regeneron Pharmaceuticals, Inc. Securities Fraud Lawsuit with the Schall Law Firm
LOS ANGELES--(BUSINESS WIRE)--REGN Investors Have Opportunity to Lead Regeneron Pharmaceuticals, Inc. Securities Fraud Lawsuit with the Schall Law Firm...
-
Samenvatting: Yoshihiro Shimamura voegt zich bij de “Investors Circle 2026” van Marché du Film als uitgenodigde investeerder ter ondersteuning van een nieuwe speelfilm
OSAKA, Japan--(BUSINESS WIRE)--Shimamura Yoshihiro Film Production Co., Ltd. (Hoofdkantoor: Osaka, Japan; gevolmachtigd bestuurder: Yoshihiro Shimamura), een bedrijf actief in filmproductie en investeringen, maakte vandaag bekend dat gevolmachtigd bestuurder Yoshihiro Shimamura heeft beslist om in een internationale speelfilm te investeren nadat het bedrijf werd uitgenodigd bij de “Investors Circle 2026” — een onderscheiding die zijn standing weerspiegelt als een van de hoogst aangeschreven fil...

-
Riassunto: Yoshihiro Shimamura entra a far parte dell’“Investors Circle 2026” del Marché du Film come investitore invitato, sostenendo un nuovo lungometraggio
OSAKA, Giappone--(BUSINESS WIRE)--Shimamura Yoshihiro Film Production Co., Ltd. (sede centrale: Osaka, Giappone; direttore rappresentativo: Yoshihiro Shimamura), società attiva nella produzione e negli investimenti cinematografici, oggi ha annunciato che il Direttore rappresentativo Yoshihiro Shimamura ha deciso di investire in un lungometraggio internazionale dopo essere stato invitato all’“Investors Circle 2026” – un riconoscimento che ne rispecchia la reputazione di uno dei produttori e inve...

-
Yoshihiro Shimamura intègre l'« Investors Circle 2026 » du Marché du Film en tant qu'investisseur invité et apporte son soutien à un nouveau long métrage
OSAKA, Japon--(BUSINESS WIRE)--Shimamura Yoshihiro Film Production Co., Ltd. (Siège social : Osaka, Japon ; administrateur délégué : Yoshihiro Shimamura), société active dans la production et l'investissement cinématographiques, a annoncé aujourd'hui que son administrateur délégué, Yoshihiro Shimamura, a décidé d'investir dans un long métrage international après avoir été invité à intégrer l'« Investors Circle 2026 ». Cette distinction témoigne de son statut de producteur et d'investisseur parm...

-
Resumen: Yoshihiro Shimamura se une al «Investors Circle 2026» del Marché du Film como inversor invitado y apuesta por un nuevo largometraje
OSAKA, Japón--(BUSINESS WIRE)--Shimamura Yoshihiro Film Production Co., Ltd. (Sede central: Osaka, Japón; director representante: Yoshihiro Shimamura), una empresa dedicada a la producción e inversión cinematográfica, ha anunciado hoy que su director representante, Yoshihiro Shimamura, ha decidido invertir en un largometraje internacional tras recibir una invitación para formar parte del «Investors Circle 2026», un reconocimiento que refleja su prestigio como uno de los productores e inversores...