

Newsroom
Sorted by: Latest
-
AFYREN : Concrétisation de la montée en puissance industrielle : progression notable des ventes au premier semestre 2026
CLERMONT-FERRAND, France & LYON, France--(BUSINESS WIRE)--Regulatory News: AFYREN (Paris:ALAFY), société de greentech qui offre aux industriels des produits biosourcés et bas-carbone grâce à sa technologie de fermentation unique basée sur un modèle complètement circulaire, fait un point d’étape sur la performance opérationnelle et les ventes de l’usine AFYREN NEOXY à l’occasion de son assemblée générale ordinaire et extraordinaire du 16 juin 2026. Nicolas SORDET, Directeur Général d’AFYREN, déc...
-
AFYREN Reports Concrete Progress in Industrial Ramp-Up: Notable Increase in Sales in the First Half of 2026
CLERMONT-FERRAND, France & LYON, France--(BUSINESS WIRE)--Regulatory News: AFYREN (Paris:ALAFY), a greentech company offering manufacturers biobased, low-carbon ingredients through a unique fermentation technology based on a circular model, provides an update on the operational performance and sales of the AFYREN NEOXY plant at its Ordinary and Extraordinary General Meeting held on June 16, 2026. Nicolas SORDET, Chief Executive Officer of AFYREN, commented: “AFYREN is producing, shipping and in...
-
ACI Worldwide Powers Rabobank’s Wero Instant Payments, Advancing Europe’s Real-Time Payments Transformation
OMAHA, Neb.--(BUSINESS WIRE)--ACI Worldwide (NASDAQ: ACIW), an original innovator in global payments technology, today announced that Rabobank, a leading Dutch bank and one of Europe’s largest financial institutions, is advancing the migration of the Netherlands’ most widely used payment method, iDEAL, to Wero. Wero is the European Payments Initiative (EPI)-backed digital payment solution enabling real-time account-to-account payments across participating European banks. Rabobank’s Wero payment...

-
Teledyne FLIR Defense Unveils Three Vehicle Vision Systems for Enhanced Battlefield Awareness
PARIS--(BUSINESS WIRE)--Teledyne FLIR Defense, part of Teledyne Technologies Incorporated (NYSE:TDY), today announced at Eurosatory the launch of three upgraded vision systems for military vehicles that enhance targeting, improve driver vision, and expand field-of-view up to 360 degrees. The newly launched solutions include the ThermoVision® Situational Awareness HD (SA90-HD) and ThermoVision® Driver Vision HD (DV55-HD) Vehicle Vision Systems, and the MilSight® LIRC III Compact Vehicle-Mounted...

-
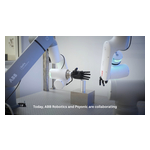
ABB Robotics and PSYONIC Use Human-Generated Data to Advance Robotic Dexterity
SAN DIEGO--(BUSINESS WIRE)--ABB Robotics is collaborating with California bionics company, PSYONIC, to advance robotic gripping and dexterity using a new approach that utilizes real-world manipulation data from human prosthetic use. By combining the PSYONIC Ability Hand with an ABB GoFa™ cobot, the collaboration will explore how touch and motion data generated by human prosthetic use can be used to train robots to perform delicate, variable tasks that have traditionally been difficult to automa...
-
Cognite Expands Regional Strategy to Advance India AI Manufacturing and Leadership Initiatives
BENGALURU, India--(BUSINESS WIRE)--Cognite, the global leader in Industrial AI, today announced a commercial expansion focusing on India’s manufacturing sector – directly helping advance the nation’s ambitious "Make in India," “Digital India,” and "INDIAai" initiatives (1). This builds on Cognite’s previous 2025 India Center of Excellence investment and reinforces the commitment to this dynamic, tech-forward market. By bridging critical gaps between legacy industrial systems and scalable artifi...
-
Signaloid Announces Availability of Amazon AWS Machine Image (AMI) for Accelerating Compute Workloads Ranging from Finance to Reinforcement Learning
CAMBRIDGE, England--(BUSINESS WIRE)--British computing technology company Signaloid today announced the release of the Signaloid Compute Engine Amazon Machine Image (AMI) via AWS Marketplace. The release enables organizations to deploy Signaloid’s distribution-extended compute hardware (UxHw®) technology within their Amazon Virtual Private Clouds (VPCs). The AMI provides access to UxHw, which delivers orders-of-magnitude performance improvements on x86_64 and ARM (AArch64) AWS Elastic Compute C...
-
Onera annonce l'intégration de sa solution Onera hPSG® dans Somnoware
EINDHOVEN, Pays-Bas--(BUSINESS WIRE)--Onera Health, leader dans la transformation de la médecine du sommeil, annonce que sa solution de bout en bout, Onera hPSG®, qui permet de réaliser une polysomnographie à domicile, est désormais intégrée dans le logiciel de gestion de laboratoire du sommeil « Somnoware by ResMed ». Cette intégration permet aux médecins de réaliser des tests de polysomnographie (PSG) en assurant aux patients un sommeil confortable à leur domicile, tout en gérant l'ensemble d...

-
Onera gibt Integration der Onera hPSG® Lösung in Somnoware bekannt
EINDHOVEN, Niederlande--(BUSINESS WIRE)--Onera Health, ein Vorreiter bei der Weiterentwicklung der Schlafmedizin, gibt bekannt, dass seine Komplettlösung für häusliche Polysomnographie, die Onera hPSG® Lösung, nun in die Somnoware-Plattform der Schlafdiagnostik- und Patientenmanagement-Software von ResMed integriert ist. Diese Integration ermöglicht es Klinikern, Polysomnographietests (PSGs) durchzuführen, wo Patienten am bequemsten schlafen - in ihrem eigenen Zuhause, d.h. während der gesamten...

-
Samenvatting: Onera kondigt de integratie van de Onera hPSG®-oplossing in Somnoware aan
EINDHOVEN, Nederland--(BUSINESS WIRE)--Onera Health, een leider gespecialiseerd in transformatie van slaapgeneeskunde, maakt bekend dat Onera hPSG®, haar end-to-end polysomnografieoplossing voor thuisgebruik, voortaan opgenomen is in Somnoware by ResMed, de beheersoftware voor slaaplabs. Dankzij deze integratie kunnen artsen PSG's (polysomnografietesten) uitvoeren op de plaats waar patiënten het meest comfortabel slapen, namelijk bij hen thuis, terwijl de volledige workflow in Somnoware wordt b...
