

Newsroom
Sorted by: Latest
-
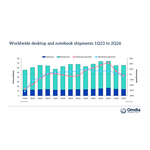
Omdia:全球PCPC市場在供應壓力加劇的背景下於2026年第二季下滑4%
倫敦--(BUSINESS WIRE)--(美國商業資訊)-- Omdia最新研究指出,全球桌上型電腦、筆記型電腦和工作站的出貨量於2026年第二季較去年同期衰減3.6%至6570萬台。桌上型電腦(含桌上型工作站)出貨量為1390萬台,較去年同期下降1.3%;筆記型電腦(含行動工作站)出貨量為5170萬台,較去年同期下降4.2%。 「記憶體和儲存價格在今年第一季急劇上漲,對第二季的產品定價造成顯著的影響。」Omdia首席分析師(Principal Analyst)Ben Yeh說,「這個現象也促使消費者和資科決策者提前購買PC,以避免未來價格進一步上揚的風險。儘管銷售量保持穩定,但市場繼續下滑的風險仍然存在。」 Apple最近決定上調MacBook系列所有產品的售價,成為市場關注的重要話題。然而,其他PC廠商早在2025年第四季末便已開始漲價,並持續按季度調整價格。同類產品線的價格較去年同期上漲了20%至40%。 「繼上半年出現需求提前釋出的現象之後,供應吃緊的具體作用逐漸浮現,目前的跡象顯示市場將有一段時間處於需求遞延的狀態。」Omdia研究主任Ishan Dutt說,「Omdia在...
-
FM and PURE Insurance Partner to Strengthen Loss Prevention for High-Value Homes
JOHNSTON, R.I. & WHITE PLAINS, N.Y.--(BUSINESS WIRE)--FM, a leading commercial property insurer known for its science- and engineering-led approach to risk management, and PURE Insurance (PURE), the reciprocal insurer exclusively serving high-net-worth families across the United States and Canada, today announced a strategic partnership, expanding FM’s leading loss prevention capabilities to protect high-value residential homes. The partnership establishes a long-term collaboration to bring FM’...
-
DEWA International est lancée en tant que filiale indépendante détenue à 100 % par DEWA pour développer des projets énergétiques et hydrauliques à l'échelle mondiale
Dubaï, Émirats arabes unis--(BUSINESS WIRE)--Son Altesse Cheikh Ahmed bin Saeed Al Maktoum, président du Conseil suprême de l'énergie de Dubaï, a annoncé la création de 'DEWA International', une filiale indépendante détenue à 100 % par la Dubai Electricity and Water Authority (DEWA). Cette nouvelle société a pour objectif de développer des projets d'énergie conventionnelle et propre à travers le monde, tout en exportant vers les marchés internationaux le modèle éprouvé de Dubaï en matière d'inf...

-
ABL Diagnostics : Cession d'un nouveau bloc d'actions par son actionnaire principal ABL
WOIPPY, France--(BUSINESS WIRE)--Regulatory News: ABL Diagnostics (Paris:ABLD) informe que son actionnaire principal, Advanced Biological Laboratories (ABL), une société de diagnostic luxembourgeoise, a déposé, via ONDE, le dispositif centralisé de dépôt des informations auprès de l’Autorité des marchés financiers (AMF), une information relative à la cession d'un nouveau bloc d'actions ABL Diagnostics dans le cadre d'une opération de gré à gré avec un tiers privé. Le dépôt relatif à cette cessi...
-
HSBC Bank Plc UK Regulatory Announcement: FRN Variable Rate Fix
LONDON--(BUSINESS WIRE)-- 08-July-2026 Issue: Mitsubishi HC Capital UK Plc Series 951 XS3142525354 Pursuant to our appointment as Agent for the above stated issue, please be advised of the following interest rate determination: Date From: 14-April-2026 Date To: 14-July-2026 Record Date: 13-July-2026 Value Date: 14-July-2026 Benchmark Rate: 3.63269% Margin: 0.5% Total Rate: 4.13269% Floor: 0% Number of Days: 91 Day Count: Actual / 360 Interest Frequency: Quarterly Total Amount Due: USD 417,860....
-
SureWerx Appoints Erik Pertot as VP/GM SureWerx EMEA
CHICAGO--(BUSINESS WIRE)--SureWerx, a leading global manufacturer of personal protective equipment, safety products, tools and equipment solutions, today announced the appointment of Erik Pertot as VP/GM SureWerx EMEA. Pertot will report directly to CEO Scott Dowell and will lead growth, manufacturing and M&A activities in Europe across the company’s global portfolio. Erik joins SureWerx with more than 20 years of international leadership experience across engineering, quality, marketing, s...
-
ABL Diagnostics: Sale of a New Block of Shares by Its Main Shareholder ABL
WOIPPY, France--(BUSINESS WIRE)--Regulatory News: ABL Diagnostics (Paris:ABLD) announces that its main shareholder, Advanced Biological Laboratories (ABL), a Luxembourg-based diagnostics company, has filed information with the French Financial Markets Authority (AMF) via ONDE, the centralized information filing system, regarding the sale of a new block of ABL Diagnostics shares as part of an over-the-counter transaction with a private third party. The filing relating to this sale can be viewed...
-
HSBC Bank Plc UK Regulatory Announcement: FRN Variable Rate Fix
LONDON--(BUSINESS WIRE)-- 09-July-2026 Issue: Bank of Montréal Series 374 XS2798993858 Pursuant to our appointment as Agent for the above stated issue, please be advised of the following interest rate determination: Date From: 13-July-2026 Date To: 13-October-2026 Record Date: 12-October-2026 Value Date: 13-October-2026 Benchmark Rate: 2.378% Margin: 0.47% Total Rate: 2.848% Floor: 0% Number of Days: 92 Day Count: Actual / 360 Interest Frequency: Quarterly Denomination: EUR 1,000.00 Amount per...
-
Pershing Square Holdings, Ltd. UK Regulatory Announcement: Transaction in Own Shares
LONDON--(BUSINESS WIRE)-- Pershing Square Holdings, Ltd. Announces Transactions in Own Shares - 9 July 2026 Pershing Square Holdings, Ltd. (LN:PSH) (LN:PSHD) (“PSH”) today announced that it has purchased, through PSH’s agent, Jefferies International Limited (“Jefferies”), the following number of PSH’s Public Shares of no par value (ISIN Code: GG00BPFJTF46) (the "Shares"): Total Buyback Ticker/s: PSH (LSE); PSHD (LSE) Date of Purchase: 9 July 2026 Number of Public Shares Purchased: 36,055 Sha...
-
BW LPG Limited Announces Sale of BW Elm
SINGAPORE--(BUSINESS WIRE)--BW LPG Limited (“BW LPG” or the “Company”, OSE ticker code: “BWLPG.OL”, NYSE ticker code: “BWLP”) is pleased to announce that its 52%-owned subsidiary, BW LPG India, has entered into an agreement to sell the 2007-built BW Elm for continued trading. On a 100% basis, the sale of BW Elm is expected to generate a net book gain of approximately US$36 million and net cash proceeds of around US$64 million. The vessel is scheduled for delivery to the buyer by mid-August. Kri...