

Newsroom
Sorted by: Latest
-
Andersen Global styrker sin tilstedeværelse i Indien med JMP Advisors
SAN FRANCISCO--(BUSINESS WIRE)--Andersen Global indgår en samarbejdsaftale med JMP Advisors i Indien og tilføjer skattemæssig ekspertise til virksomhedens eksisterende juridiske kapaciteter i landet. JMP Advisors tilbyder rådgivning inden for skat, lovgivning og transaktioner til både nationale og multinationale klienter, der opererer i komplekse forretningsmiljøer i konstant udvikling. Firmaet leverer ydelser, der spænder over international og indisk skat, transfer pricing, international struk...
-
Riassunto: WISE chiude un round di finanziamento di serie D da 30 milioni di euro sottoscritto in eccesso, accogliendo ENEA Tech and Biomedical come nuovo investitore strategico
MILANO--(BUSINESS WIRE)--WISE S.p.A., azienda innovativa di dispositivi medici specializzata in elettrodi impiantabili all'avanguardia per il neuromonitoraggio, la neuromodulazione e le interfacce cervello-computer (BCI, Brain-Computer Interface), oggi ha annunciato la chiusura di un round di finanziamento di serie D sottoscritto in eccesso, per un totale di 30 milioni di euro. Al round ha partecipato anche ENEA Tech and Biomedical, una fondazione italiana dedicata all'innovazione e al trasferi...

-
WISE clôture un tour de table de série D sursouscrite de 30 millions d'euros et salue l'entrée d'ENEA Tech and Biomedical comme nouvel investisseur stratégique
MILAN--(BUSINESS WIRE)--WISE S.p.A., société pionnière dans le domaine des dispositifs médicaux et spécialisée dans les électrodes implantables de pointe utilisés pour le neuromonitoring, la neuromodulation et les interfaces cerveau-ordinateur (ICO), a annoncé aujourd'hui la clôture réussie d'un tour de table de série D sursouscrit, d'un montant total de 30 millions d'euros. ENEA Tech and Biomedical, une fondation italienne dédiée à l'innovation et au transfert de technologies dans le secteur b...

-
Samenvatting: WISE rondt een overtekende Serie D-financieringsronde van 30 miljoen euro af en verwelkomt ENEA Tech e Biomedical als nieuwe strategische investeerder
MILAAN--(BUSINESS WIRE)--WISE S.p.A., een toonaangevend bedrijf op het gebied van medische hulpmiddelen dat gespecialiseerd is in geavanceerde implanteerbare elektroden voor neuromonitoring, neuromodulatie en hersen-computerinterfaces (BCI), heeft vandaag bekendgemaakt dat de overtekende Serie D-financieringsronde met een totaalbedrag van 30 miljoen euro succesvol is afgerond. Aan deze ronde nam ENEA Tech e Biomedical deel. Dit is een Italiaanse stichting die zich toelegt op innovatie en techno...
-
WISE schließt überzeichnete Serie-D-Finanzierungsrunde in Höhe von 30 Millionen Euro ab und begrüßt ENEA Tech und Biomedical als neuen strategischen Investor
MAILAND--(BUSINESS WIRE)--WISE S.p.A., ein wegweisendes Medizintechnikunternehmen, das sich auf fortschrittliche implantierbare Elektroden für Neuromonitoring, Neuromodulation und Gehirn-Computer-Schnittstellen (BCI) spezialisiert hat, gab heute den erfolgreichen Abschluss einer überzeichneten Serie-D-Finanzierungsrunde in Höhe von insgesamt 30 Millionen Euro bekannt. An der Runde beteiligte sich ENEA Tech and Biomedical, eine italienische Stiftung, die sich der Innovation und dem Technologietr...

-
Resumen: WISE cierra una ronda de financiación de serie D de 30 millones de euros, que ha tenido una demanda superior a la oferta, y da la bienvenida a ENEA Tech y Biomedical como nuevos inversores estratégicos
MILÁN--(BUSINESS WIRE)--WISE S.p.A., una empresa pionera en el sector de los dispositivos médicos especializada en electrodos implantables avanzados para la neuromonitorización, la neuromodulación y la interfaz cerebro-ordenador (BCI), ha anunciado hoy el cierre con éxito de una ronda de financiación de la serie D, que ha superado la demanda prevista, por un importe total de 30 millones de euros. A esta ronda se han sumado ENEA Tech and Biomedical, una fundación italiana dedicada a la innovació...

-
iSOFT Contributes Intelligent Driving OS as AUTOSAR CAPI Global Code Baseline
SHANGHAI--(BUSINESS WIRE)--At the 17th AUTOSAR Open Conference (AOC) in Shanghai, iSOFT (iSOFT Infrastructure Software Co., Ltd.) contributed its self-developed intelligent driving operating system as the global code baseline for AUTOSAR's Common Adaptive Platform Implementation (CAPI) - a notable milestone in the evolution of the global smart vehicle industry. "This is a paradigm shift from 'standard-first' to 'code-first,' responding to new industrial demands of the intelligent connected era,...
-
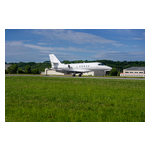
L’opération Special Olympics Airlift prend son envol à l’échelle nationale ; le Dove 1 arrive à l’aéroport de St. Paul Downtown
SAINT-PAUL, Minnesota--(BUSINESS WIRE)--L’opération 2026 Special Olympics Airlift a officiellement pris son envol aujourd’hui, alors que tous les appareils Cessna, Beechcraft et Hawker participants, surnommés les Doves, ont décollé d’aéroports situés aux quatre coins du pays. Le Dove 1 du jour d’arrivée, un Cessna Citation Latitude généreusement mis à disposition par Prent Corporation, a atterri à l’aéroport de St. Paul Downtown (STP) avec à son bord des athlètes des Jeux olympiques spéciaux et...
-
CORRECTING and REPLACING Two Prime Earns SOC 1 Type 2 and SOC 2 Type 2 Designation
NEW YORK--(BUSINESS WIRE)--Please replace the release dated June 9, 2026 with the following corrected version due to multiple revisions. The updated release reads: TWO PRIME EARNS SOC 1 TYPE 2 AND SOC 2 TYPE 2 DESIGNATION Independent third-party examinations validate operating effectiveness of firm’s financial reporting, security, and confidentiality controls. Examinations revealed no exceptions to SOC standards. Two Prime Inc. (“Two Prime” or “the firm”), a leading provider of bitcoin financia...
-
NVCR Investors Have Opportunity to Join NovoCure Limited Fraud Investigation with the Schall Law Firm
LOS ANGELES--(BUSINESS WIRE)--NVCR Investors Have Opportunity to Join NovoCure Limited Fraud Investigation with the Schall Law Firm...