

Newsroom
Sorted by: Latest
-
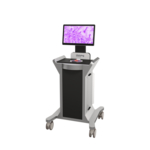
La technologie du scanner Histolog® de SamanTree Medical est mise à l’honneur dans treize articles publiés dans un numéro spécial de la revue BJU International consacré à la microscopie confocale dans le domaine de l’urologie
LIEGE, Belgique--(BUSINESS WIRE)--SamanTree Medical, un chef de file mondial dans le domaine de l’innovation en imagerie chirurgicale, a annoncé aujourd’hui que sa technologie de microscopie confocale via le scanner Histolog était mentionnée dans treize articles cliniques évalués par des pairs, publiés dans un numéro spécial de BJU International, l’une des revues les plus prestigieuses au monde dédiées à l’urologie. Ce numéro spécial est consacré aux preuves de plus en plus nombreuses qui appui...
-
Millennium Partners, L.P. UK Regulatory Announcement: Form 8.3
LONDON--(BUSINESS WIRE)-- FORM 8.3 PUBLIC OPENING POSITION DISCLOSURE/DEALING DISCLOSURE BY A PERSON WITH INTERESTS IN RELEVANT SECURITIES REPRESENTING 1% OR MORE Rule 8.3 of the Takeover Code (the “Code”) 1. KEY INFORMATION (a) Full name of discloser: Millennium International Management LP (b) Owner or controller of interests and short positions disclosed, if different from 1(a): The naming of nominee or vehicle companies is insufficient. For a trust, the trustee(s), settlor and beneficiari...
-
Millennium Partners, L.P. UK Regulatory Announcement: Form 8.3
LONDON--(BUSINESS WIRE)-- Ap27 FORM 8.3 IRISH TAKEOVER PANEL OPENING POSITION DISCLOSURE/DEALING DISCLOSURE UNDER RULE 8.3 OF THE IRISH TAKEOVER PANEL ACT, 1997, TAKEOVER RULES, 2022 BY PERSONS WITH INTERESTS IN RELEVANT SECURITIES REPRESENTING 1% OR MORE 1. KEY INFORMATION (a) Full name of discloser Millennium International Management LP (b) Owner or controller of interests and short positions disclosed, if different from 1(a) The naming of nominee or vehicle companies is insufficient. For a...
-
Pembina Pipeline Announces Positive Final Investment Decision on the Greenlight Electricity Centre
CALGARY, Alberta--(BUSINESS WIRE)--Pembina Pipeline Corporation ("Pembina" or the "Company") (TSX: PPL; NYSE: PBA), Morgan Stanley Infrastructure Partners ("MSIP"), and Kineticor Asset Management ("Kineticor"), partners in the Greenlight Electricity Centre Limited Partnership ("Greenlight") (collectively, the "Partners"), today announced a positive final investment decision on the Greenlight Electricity Centre ("GLEC" or the "Project"). GLEC is a 932 megawatt ("MW") gas-fired combined cycle pow...
-
Millennium Partners, L.P. UK Regulatory Announcement: Form 8.3
LONDON--(BUSINESS WIRE)-- FORM 8.3 PUBLIC OPENING POSITION DISCLOSURE/DEALING DISCLOSURE BY A PERSON WITH INTERESTS IN RELEVANT SECURITIES REPRESENTING 1% OR MORE Rule 8.3 of the Takeover Code (the “Code”) 1. KEY INFORMATION (a) Full name of discloser: Millennium International Management LP (b) Owner or controller of interests and short positions disclosed, if different from 1(a): The naming of nominee or vehicle companies is insufficient. For a trust, the trustee(s), settlor and beneficiari...
-
Millennium Partners, L.P. UK Regulatory Announcement: Form 8.3
LONDON--(BUSINESS WIRE)-- Ap27 FORM 8.3 IRISH TAKEOVER PANEL OPENING POSITION DISCLOSURE/DEALING DISCLOSURE UNDER RULE 8.3 OF THE IRISH TAKEOVER PANEL ACT, 1997, TAKEOVER RULES, 2022 BY PERSONS WITH INTERESTS IN RELEVANT SECURITIES REPRESENTING 1% OR MORE 1. KEY INFORMATION (a) Full name of discloser Millennium International Management LP (b) Owner or controller of interests and short positions disclosed, if different from 1(a) The naming of nominee or vehicle companies is insufficient. For a...