

Newsroom
Sorted by: Latest
-
Samenvatting: PK MED versterkt zijn strategisch en wetenschappelijk bestuur om de ontwikkeling van zijn therapeutische micro-implantaten te ondersteunen
PARIJS & LYON, Frankrijk--(BUSINESS WIRE)--PK MED, een Frans biotechnologiebedrijf opgericht door Truffle Capital (oprichter van Abivax en Carvolix), dat therapeutische micro-implantaten ontwikkelt bedoeld voor de belangrijkste medische behoeften, kondigde vandaag een aanzienlijke versterking van zijn bestuur aan. Het bedrijf verstevigt de structuur van zijn Raad van Bestuur en van de Wetenschappelijke Adviesraad om de nakende start te steunen van de Fase 2 van ARTHRELIS (behandeling van jichta...
-
Resumen: PK MED fortalece su liderazgo estratégico y científico para respaldar el desarrollo de sus microimplantes terapéuticos
PARÍS y LYON (Francia)--(BUSINESS WIRE)--PK MED, una empresa de biotecnología francesa creada por Truffle Capital (fundadora también de Abivax y Carvolix) que desarrolla microimplantes terapéuticos para abordar importantes necesidades médicas, anunció hoy un fortalecimiento significativo de su liderazgo. La empresa solidificará la estructura de su Junta Directiva y Comité Científico Asesor para respaldar el inminente ingreso a fase 2 de su candidato a fármaco más avanzado, ARTHRELIS (para el tr...
-
Riassunto: PK MED rafforza la sua governance strategica e scientifica per supportare lo sviluppo dei suoi micro impianti terapeutici
PARIGI e LIONE, Francia--(BUSINESS WIRE)--PK MED, azienda francese di biotecnologia fondata da Truffle Capital (fondatore di Abivax e Carvolix), specializzata nello sviluppo di micro impianti terapeutici per affrontare importanti esigenze mediche, oggi annuncia un notevole rafforzamento della sua governance. La società sta rafforzando la struttura del suo Consiglio di Amministrazione per supportare il prossimo ingresso nella fase 2 del suo candidato farmaco più avanzato, ARTHRELIS (trattamento...
-
K MED stärkt seine strategische und wissenschaftliche Führung, um die Entwicklung seiner therapeutischen Mikroimplantate voranzutreiben
PARIS & LYON, Frankreich--(BUSINESS WIRE)--PK MED, ein französisches Biotechnologieunternehmen, das von Truffle Capital (Gründer von Abivax und Carvolix) gegründet wurde und therapeutische Mikroimplantate zur Deckung großer medizinischer Bedürfnisse entwickelt, gibt heute eine erhebliche Stärkung seiner Unternehmensführung bekannt. Das Unternehmen stärkt die Struktur seines Vorstands und seines wissenschaftlichen Beirats, um den bevorstehenden Eintritt seines am weitesten fortgeschrittenen Wirk...
-
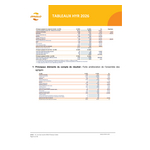
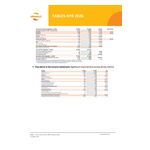
emeis : Résultats semestriels 2026
PUTEAUX, France--(BUSINESS WIRE)--Regulatory News: emeis (Paris:EMEIS): Une activité dynamique sur tous les marchés du Groupe Chiffre d’affaires en forte hausse de +6,0% à périmètre constant, soit une hausse de +103 M€ … notamment sur les Maisons de Retraite à +7,1% (cliniques à +4,1%) et à l’international à +7,5% (France à +3,7%) Hausse des taux d’occupation de +2,8 pts en moyenne sur un an (à 89,8%) et qui dépasse 90% sur le seul deuxième trimestre, avec l’amélioration des performances commer...
-
emeis: 2026 Half-Year Results
PUTEAUX, France--(BUSINESS WIRE)--Regulatory News: emeis (Paris:EMEIS): Strong performance across all of the Group’s markets Revenue rose sharply by +6.0% on a like-for-like basis, representing an increase of +€103 million … particularly in Nursing Homes at +7.1% (clinics at +4.1%) and internationally at +7.5% (France at +3.7%) Occupancy rates rose by an average of +2.8 points (to 89.8%) and exceeded 90% in the second quarter alone, driven by improved sales performance (a +22% increase in the n...
-
Corvias Passes Halfway Point on Landmark $210 Million Military Housing Modernization Program
WARWICK, R.I.--(BUSINESS WIRE)--Corvias today announced it has surpassed the halfway mark on Project Homestead, a landmark $210 million modernization initiative transforming homes for thousands of military families at Fort Bragg, N.C., Fort Meade, Md., and Fort Rucker, Ala. With 1,215 of 2,388 home renovations delivered ahead of schedule, overall completion stands at 51 percent. Launched in partnership with the U.S. Army, Project Homestead reflects Corvias’ continued commitment to advancing qua...

-
Hims & Hers Responds to FTC Lawsuit
SAN FRANCISCO--(BUSINESS WIRE)--Hims & Hers Health, Inc. (NYSE: HIMS) responded to the lawsuit filed today by the Federal Trade Commission (FTC): This lawsuit disregards substantial evidence we provided the FTC during its nearly three-year investigation, ignores established state laws and industry standards in telehealth, and contorts the law to try to manufacture claims. This is not enforcement grounded in consumer protection; it is an effort to generate headlines at our expense. We are co...
-
Hanwha Energy USA Subsidiary Expands Retail Electricity Business in PJM
HOUSTON--(BUSINESS WIRE)--174 Power Global Retail Corporation, a wholly owned subsidiary of Hanwha Energy USA Holdings Corporation, today announced its entry into competitive retail electricity markets within the PJM region. 174 Power Global Retail Corporation, which operates Chariot Energy and Pumpjack Power in Texas, has acquired Powervine Energy, LLC and Powervine Energy MD, LLC. Subject to applicable state licensing and regulatory requirements, the company will market and sell retail electr...
-
RDi USA Inc. Launches at ADLM 2026, Bringing Automated Diagnostic Kitting and Connected Self-Sampling Pathways to the U.S.
ANAHEIM, Calif.--(BUSINESS WIRE)--RDi today announced the launch of RDi USA Inc. at the ADLM 2026 Clinical Lab Expo, where the new U.S. business will make its official industry debut at Booth #4454 from July 28–30. RDi USA has been created to help laboratories, diagnostic manufacturers, healthcare providers, screening organizations and research partners overcome one of the largest barriers to scaling diagnostic testing: the fragmented infrastructure surrounding the test itself, for partners ope...