Newsroom
Sorted by: Latest
-
MotionElements Launches All-in-One Pro plan, Establishing a Unified Creative Ecosystem to Eliminate Subscription Fatigue
SINGAPORE--(BUSINESS WIRE)--MotionElements launched its Pro plan, combining royalty-free stock assets and generative AI to streamline fragmented video production workflows....
-
Stonebranch als Repräsentativer Anbieter in 2026 Gartner® erwähnt; Marktführer für Automatisierung von Infrastruktur und Tools für die Orchestrierung
ALPHARETTA, Ga.--(BUSINESS WIRE)--Stonebranch, ein führender Anbieter von Lösungen für Service-Orchestrierung und -Automatisierung, gab heute bekannt, dass das Unternehmen im „Gartner Market Guide for Infrastructure Automation and Orchestration (IA&O) Tools 2026“* als repräsentativer Anbieter ausgezeichnet wurde. „Stonebranch fühlt sich geehrt, im Gartner-Marktleitfaden 2026 für IA&O-Tools erwähnt zu werden“, sagte Giuseppe Damiani, CEO von Stonebranch. „KI, Plattform-Engineering und hy...
-
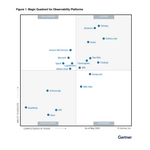
Riassunto: Grafana Labs nominata Leader nel Gartner® Magic Quadrant™ 2026 per le piattaforme di osservabilità e classificata al primo posto per completezza di visione
NEW YORK--(BUSINESS WIRE)--Grafana Labs, l'azienda alla base del cloud di osservabilità aperta, oggi ha annunciato di essere stata nominata un Leader nel Gartner® Magic Quadrant™ per le piattaforme di osservabilità per il terzo anno consecutivo, e di essersi piazzata al primo posto per la completezza di visione per il secondo anno di fila. Il testo originale del presente annuncio, redatto nella lingua di partenza, è la versione ufficiale che fa fede. Le traduzioni sono offerte unicamente per co...

-
Samenvatting: Grafana Labs is uitgeroepen tot leider in het Gartner® Magic Quadrant™ 2026 voor observability-platforms met hoogste score op het gebied van 'Volledigheid van visie'
NEW YORK--(BUSINESS WIRE)--Grafana Labs, het bedrijf achter de open observability-cloud, heeft vandaag bekendgemaakt dat het voor het derde jaar op rij is uitgeroepen tot leider in het Gartner® Magic Quadrant™ voor observability-platforms en dat het voor het tweede jaar op rij de hoogste positie inneemt op de as 'Volledigheid van visie'. Deze bekendmaking is officieel geldend in de originele brontaal. Vertalingen zijn slechts als leeshulp bedoeld en moeten worden vergeleken met de tekst in de b...

-
Resumen: Grafana Labs es reconocida como líder en el Gartner® Magic Quadrant™ 2026 para plataformas de observabilidad y ocupa la posición más avanzada en el eje de integridad de visión
NUEVA YORK--(BUSINESS WIRE)--Grafana Labs, creadora de Open Observability Cloud, ha anunciado hoy que Gartner® la ha reconocido como líder en el Magic Quadrant™ para plataformas de observabilidad por tercer año consecutivo y que, por segundo año seguido, la sitúa a la cabeza del eje de integridad de visión (Completeness of Vision). El comunicado en el idioma original es la versión oficial y autorizada del mismo. Esta traducción es solamente un medio de ayuda y deberá ser comparada con el texto...
-
NUBURU Announces $38.0 Million Public Offering Priced at Approximately 30% Premium to Advance Tekne Acquisition and Retire Outstanding Indebtedness
DENVER--(BUSINESS WIRE)--NUBURU, Inc. (NYSE American: BURU), a next-generation dual-use Defense & Security integrated platform company, today announced the pricing of a best-efforts public offering expected to generate gross proceeds of approximately $38.0 million, before deducting placement agent fees and other offering expenses. The offering consists of an aggregate of 244,372,984 shares of common stock and/or pre-funded warrants to purchase shares of common stock, together with accompany...
-
Resumen: Stonebranch obtiene el reconocimiento como Representative Vendor en la Gartner® Market Guide 2026 for Infrastructure Automation and Orchestration Tools
ALPHARETTA, Georgia--(BUSINESS WIRE)--Stonebranch, proveedor líder de soluciones de automatización y orquestación de servicios, ha anunciado hoy que Gartner la ha reconocido como Representative Vendor en la Gartner® Market Guide 2026 for Infrastructure Automation and Orchestration (IA&O) Tools. «Para Stonebranch es un honor figurar como Representative Vendor en la Gartner® Market Guide 2026 for IA&O Tools», afirmó Giuseppe Damiani, director ejecutivo de Stonebranch. «La IA, la ingenierí...
-
AST SpaceMobile Announces Pricing of Private Offering of $1.0 Billion of Convertible Senior Notes Due 2034 (Effective Conversion Price of $149.20 per Share with Capped Call)
MIDLAND, Texas--(BUSINESS WIRE)--AST SpaceMobile, Inc. (“AST SpaceMobile”) (NASDAQ: ASTS), the company building the first and only space-based cellular broadband network accessible directly by everyday smartphones, designed for both commercial and government applications, today announced the pricing of $1.0 billion aggregate principal amount of 1.625% convertible senior notes due 2034 (the “Notes”) in a private offering (the “Notes Offering”) to persons reasonably believed to be qualified insti...

-
Jabil Opens Next-Generation Intelligent Logistics Hub in Penang
PENANG, Malaysia--(BUSINESS WIRE)--Jabil Inc. (NYSE: JBL), a global leader in engineering, supply chain, and manufacturing solutions, has opened its next-generation logistics hub in Penang. Jabil’s new Intelligent Logistics Hub (or the Hub) spans around 417,000 square feet and is located in the Valdor Industrial Park in Sungai Jawi, Penang. The digitalised facility is set to boost the company’s back-end operations and support customers’ rapidly growing product complexity and capacity demands us...
-
Rambus 推出 DDR5 9600 服务器 RDIMM 芯片组,赋能下一代 AI 与数据中心平台
中国北京--(BUSINESS WIRE)--DDR5 9600 RDIMM芯片组旨在满足基于先进CPU服务器上AI及数据密集型工作负载所带来的内存性能与电源管理需求增长。...