Newsroom
Sorted by: Latest
-
WCB Workers Sound Alarm on Rising Workloads and Delays in Care for Injured Canadians
VANCOUVER, BC--(BUSINESS WIRE)--When Canadians are injured on the job, they depend on the expertise and dedication of workers at the Workers’ Compensation Boards (WCBs) across the country. But as workloads intensify and staffing pressures mount, those same workers are warning that delays in care are becoming unavoidable. That message was front and centre at a national conference of WCB unions held this week, bringing together delegates from the Canadian Union of Public Employees (CUPE), the Nat...
-
Aliko Scientific Signs Memorandum of Understanding with BioBrasil for Brazilian FISH Probe Manufacturing Joint Venture
PARIS--(BUSINESS WIRE)--Regulatory News: Aliko Scientific SA (former Ikonisys SA) (Euronext Growth Paris: ALIKO) – today announced the signing of a Memorandum of Understanding (“MOU”) with BioBrasil to establish a joint venture focused on the production of FISH (Fluorescence In Situ Hybridization) probes in Brazil. Francesco Trisolini, CEO of Aliko Scientific, commented: “This agreement represents a significant strategic milestone for Aliko Scientific. In addition to revenues generated from the...
-
Aliko Scientific SA signe un protocole d’accord avec BioBrasil pour une coentreprise de fabrication de sondes FISH au Brésil
PARIS--(BUSINESS WIRE)--Regulatory News: Aliko Scientific SA (Euronext Growth Paris : ALIKO) – a annoncé aujourd’hui la signature d’un protocole d’accord (« MOU ») avec BioBrasil afin de créer une coentreprise dédiée à la production de sondes FISH (Hybridation in situ par fluorescence) au Brésil. Francesco Trisolini, CEO d’Aliko Scientific, a commenté : « Cet accord représente une étape stratégique importante pour Aliko Scientific. En plus des revenus générés par la vente de systèmes de diagnos...
-
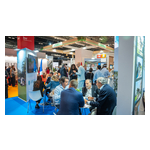
Larimar Positions Itself at SIMA as a Benchmark for International Real Estate Investment
MADRID--(BUSINESS WIRE)--Larimar City & Resort, the smart city being developed in the Dominican Republic by the Spanish company CLERHP, has successfully concluded its participation at SIMA 2026, receiving an outstanding response from the professional audience and reinforcing its position as one of the most promising international real estate projects in the market. Throughout the event in Madrid, Larimar attracted the attention of real estate operators, investors, sales networks, and potent...

-
Larimar se posiciona en SIMA como referente en la inversión inmobiliaria internacional
MADRID--(BUSINESS WIRE)--Larimar City & Resort, la smart city que la empresa española CLERHP desarrolla en República Dominicana, ha cerrado su participación en SIMA 2026 con una gran acogida por parte del público profesional, reforzando su posicionamiento como uno de los proyectos inmobiliarios internacionales con mayor proyección del mercado. Durante las jornadas celebradas en Madrid, Larimar despertó el interés de operadores inmobiliarios, inversores, grupos de comercialización y potencia...
-
MEMSCAP: DIFFUSION EN DIRECT DE L’ASSEMBLEE GENERALE ORDINAIRE ANNUELLE DU 4 JUIN 2026
GRENOBLE, France--(BUSINESS WIRE)--Regulatory News: MEMSCAP (Euronext Paris : MEMS), fournisseur leader de solutions de capteurs de pression de haute précision et de forte stabilité pour les marchés de l’aéronautique et du médical, utilisant la technologie des MEMS (Micro Electro Mechanical Systems), annonce la diffusion en direct de sa prochaine assemblée générale ordinaire annuelle. L’assemblée générale ordinaire annuelle des actionnaires de MEMSCAP (Euronext Paris : MEMS) se tiendra le 4 jui...
-
NFL Biosciences renforce son approche de médecine personnalisée dans le sevrage tabagique avec une nouvelle demande de brevet
MONTPELLIER, France--(BUSINESS WIRE)--Regulatory News: NFL BIOSCIENCES (Euronext Growth Paris – FR0014003XT0 – ALFNL), société biopharmaceutique développant des médicaments botaniques innovants pour le traitement des addictions, annonce aujourd’hui le dépôt d’une demande de brevet protégeant un biomarqueur prédictif d’efficacité associé à NFL-101, candidat-médicament dans le sevrage tabagique. Bruno Lafont, Directeur Général et co-fondateur de NFL Biosciences, déclare : « Le dépôt de cette dema...
-
NFL Biosciences Is Strengthening Its Personalized Medicine Approach to Smoking Cessation With a New Patent Application
MONTPELLIER, France--(BUSINESS WIRE)--Regulatory News: NFL BIOSCIENCES (Euronext Growth Paris – FR0014003XT0 – ALFNL), a biopharmaceutical company developing innovative botanical drugs for the treatment of addictions, today announces the filing of a patent application protecting a predictive efficacy biomarker associated with NFL-101, drug candidate for smoking cessation. Bruno Lafont, Chief Executive Officer and co-founder of NFL Biosciences, states: “The filing of this patent application mark...
-
Millennium Partners, L.P. UK Regulatory Announcement: Form 8.3
LONDON--(BUSINESS WIRE)-- Ap27 FORM 8.3 IRISH TAKEOVER PANEL OPENING POSITION DISCLOSURE/DEALING DISCLOSURE UNDER RULE 8.3 OF THE IRISH TAKEOVER PANEL ACT, 1997, TAKEOVER RULES, 2022 BY PERSONS WITH INTERESTS IN RELEVANT SECURITIES REPRESENTING 1% OR MORE 1. KEY INFORMATION (a) Full name of discloser Millennium International Management LP (b) Owner or controller of interests and short positions disclosed, if different from 1(a) The naming of nominee or vehicle companies is insufficient. For a...
-
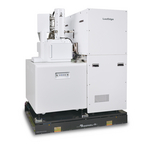
JEOL : lancement commercial du système SEM laser « LazEdge »
TOKYO--(BUSINESS WIRE)--JEOL Ltd. (président-directeur général : Izumi Oi) a développé le « LazEdge », un système SEM équipé d’un système de traitement laser, dont la commercialisation débutera le 25 mai 2026. Les instruments de préparation de coupes transversales, tels que le système à faisceau ionique focalisé (système FIB), sont couramment utilisés dans les domaines scientifiques et technologiques au sein des instituts de recherche, des universités et des industries. Ces dernières années, la...