

Newsroom
Sorted by: Latest
-
Badar Family Office Expands Into the World's Most Exclusive Automotive Brands With Acquisition of McLaren Charlotte and Rolls-Royce Motor Cars Charlotte
CHARLOTTE, N.C.--(BUSINESS WIRE)--Badar Family Office Expands into the World's Most Exclusive Automotive Brands with Acquisition of McLaren Charlotte & Rolls-Royce Motor Cars Charlotte...

-
セキュア・コード・ウォリアーの調査で、AI生成コードがコードベース当たり平均15件の脆弱性をもたらすことが判明
シドニー、ボストン、ロンドン--(BUSINESS WIRE)--(ビジネスワイヤ) -- セキュア・コード・ウォリアーは、AIソフトウエア・ガバナンスと開発者のセキュリティースキル向上支援の分野をリードする企業であり、SCW AI Trust Indexを発表しました。これは、新たなモデルが加わるたびに拡充される、AIによるコード生成のセキュリティーに関する継続的なベンチマークであり、組織がAI生成コードによって生じるセキュリティー・リスクを把握し、管理できるよう支援します。本調査では、オーストラリアのRMIT大学と共同で策定され、その後セキュア・コード・ウォリアーが拡張した手法を用い、主要な大規模言語モデル(LLM)がセキュリティーに問題のあるコードを生成する頻度について、包括的なベンチマークを提示しています。この調査結果は、AI支援開発を拡大するすべての企業に重要な示唆を与えます。 OpenAI、アンソロピック、Google、アリババなどの16種の最先端モデルが生成した完全なコードベース1,760件を評価した結果、AI生成コードにはコードベース当たり平均15件の脆弱性が確認され...
-
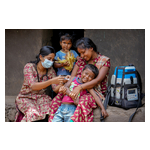
扎耶德可持续发展奖的Beyond2020计划为印度超过20万人增强医疗系统韧性
阿联酋阿布扎比--(BUSINESS WIRE)--(美国商业资讯)-- 作为阿联酋为应对全球挑战的创新解决方案设立的开创性奖项,扎耶德可持续发展奖(Zayed Sustainability Prize)发起的旗舰倡议Beyond2020今日宣布,已在印度部署多座太阳能供电的医疗中心,为超过20万人改善了获得可靠医疗服务的途径。 该项目在印度西南部的卡纳塔克邦落地,共部署了六座配备节能医疗技术的太阳能医疗设施。这些设施增强了电力供应受限的偏远社区的医疗系统韧性,使患者能够在家附近获得基本医疗服务,而无需长途跋涉前往大城市。 此次在印度的Beyond2020部署由SELCO基金会执行。该基金会是2018年扎耶德可持续发展奖得主,是一家总部位于印度的非营利组织,致力于利用可持续能源作为支持减贫和环境可持续发展的催化剂。 阿联酋卫生和预防部部长Ahmed Ali Al Sayegh阁下表示:“通过Beyond2020计划,阿联酋继续倡导改善生活、增强韧性并促进全球合作的解决方案。此次在印度的部署所产生的持续影响,反映了我们推进可持续发展和扩大基本医疗服务公平获取的共同承诺。在Sheikh Z...

-
扎耶德永續發展獎的Beyond2020計畫為印度逾20萬人強化醫療系統韌性
阿聯阿布達比--(BUSINESS WIRE)--(美國商業資訊)-- 扎耶德永續發展獎(Zayed Sustainability Prize)是阿拉伯聯合大公國為因應全球挑戰的創新解決方案設立的開創性獎項,其提出的旗艦倡議Beyond2020今日宣布,已在印度部署多座太陽能供電的醫療中心,為逾20萬人改善獲得可靠醫療服務的途徑。 該專案在印度西南部的卡納塔卡邦落地,共部署六座配備節能醫療技術的太陽能醫療設施。這些設施強化了電力供應受限的偏遠社群的醫療系統韌性,使病患能夠在家附近獲得基本醫療服務,而無需長途跋涉前往大城市。 此次在印度的Beyond2020部署由SELCO基金會執行。該基金會是2018年扎耶德永續發展獎得主,是一家總部位於印度的非營利組織,致力於利用永續能源推動支援減貧和環境永續發展。 阿拉伯聯合大公國衛生和預防部長Ahmed Ali Al Sayegh閣下表示:「透過Beyond2020計畫,阿拉伯聯合大公國繼續宣導改善生活、強化韌性並促進全球合作的解決方案。此次在印度的部署所產生的持續影響力,反映了我們推進永續發展和擴大基本醫療服務公平取得途徑的共同承諾。在Shei...

-
ザーイド・サステナビリティ賞、Beyond2020イニシアチブがインドで20万人以上の医療レジリエンス強化に貢献
アラブ首長国連邦アブダビ--(BUSINESS WIRE)--(ビジネスワイヤ) -- 世界的な課題に対する革新的な解決策を表彰するアラブ首長国連邦(UAE)の先駆的な賞である「ザーイド・サステナビリティ賞」は、その主要イニシアチブであるBeyond2020により、インドに太陽光発電を利用した医療センターを設置し、20万人以上が安定した医療サービスを受けられるようになったことを発表しました。 インド南西部のカルナータカ州で完了したこのプロジェクトには、省エネ型の医療技術を備えた太陽光発電を利用した医療施設6か所が整備されました。これらの施設は、電力へのアクセスが限られている遠隔地の地域社会における医療レジリエンスを強化し、患者が大都市まで長距離を移動することなく、自宅の近くで必要な医療サービスを受けられるようにします。 インドにおけるBeyond2020イニシアチブは、2018年のザーイド・サステナビリティ賞を受賞し、インドを拠点とする非営利団体セルコ財団が実施しました。同財団は、持続可能なエネルギーを原動力として活用し、貧困の解消および環境の持続可能性を推進しています。 UAEの保...
-
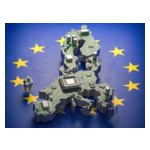
شركة Gradiant تدعم التوسع البارز في مجال تصنيع أشباه الموصلات في دريسدن
بوسطن--(BUSINESS WIRE)--أعلنت اليوم شركة Gradiant، الرائدة عالميًا في مجال حلول المياه ومياه الصرف الصحي المتقدمة، عن إكمال أعمالها بنجاح في منشأة جديدة رئيسية لتصنيع أشباه الموصلات في مدينة دريسدن، بما يعزز قدرة أوروبا على إنتاج التقنيات التي تدعم عالمًا يتجه بصورة متزايدة نحو الرقمنة والكهربة.يتناول هذا البيان الصحفي الوسائط المتعددة. يمكنك الاطلاع على البيان كاملاً هنا: https://www.businesswire.com/news/home/20260721736119/ar/أعلنت Gradiant اليوم عن الإتمام المبكر لأنظمة المياه فائقة النقاء و...
-
Dallas Appeals Court Decision Protects Integrity of Trial Agreements
DALLAS--(BUSINESS WIRE)--The Fifth Court of Appeals in Dallas has affirmed a trial court judgment secured by Johnston Tobey Baruch partner Chad Baruch, issuing an opinion that reinforces the binding nature of trial stipulations and provides important guidance for Texas trial and appellate practice. "The integrity of the trial process depends on parties being held to the agreements they make in court," said Mr. Baruch. "Trial stipulations are binding commitments, not strategic placeholders. This...
-
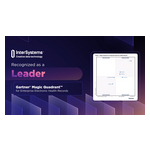
InterSystems 被评为 Gartner®《企业电子健康记录魔力象限™》中的领导者
波士顿--(BUSINESS WIRE)--(美国商业资讯)-- InterSystems是一家创新型数据技术提供商,其技术支持着全球超过10亿份健康记录,该公司今日宣布,在2026年 Gartner企业电子健康记录(EHR)魔力象限报告中被评为“领导者”。 Gartner“魔力象限”是针对特定市场所进行研究的集大成之作,可让您全面了解该市场中各竞争对手的相对地位。 通过采用图表化呈现方式和统一的评估标准,“魔力象限”可帮助您快速了解技术提供商在多大程度上实现了其既定愿景,以及其表现与高德纳(Gartner)的市场展望相比如何。 “医疗保健机构在面临现代化转型压力的同时,仍需每天持续提供安全、可靠的医疗服务,”InterSystems总裁唐·伍德洛克表示。 “我们解决方案的优势一直在于将久经考验的全球规模、深度互操作性以及企业级AI能力相结合,帮助临床医生和医疗机构按照自己的节奏实现现代化转型,同时继续为患者提供世界一流的医疗服务。” InterSystems 凭借其电子健康记录(EHR)近期获得的欧盟 IIa 类医疗器械法规(MDR)认证,继续在区域及国家层面的健康信息交换以及监管审...
-
Samenvatting: RecVue lanceert eerste AI-native agentisch omzetbeheersysteem
PALO ALTO, Calif.--(BUSINESS WIRE)--RecVue, de leider in oplossingen voor facturering en omzetbeheer, heeft vandaag de evolutie van RecVue RevOS aangekondigd in het eerste agentgebaseerde omzetbeheersysteem in de branche. In een architectonische verandering tilt het nu native agentische platform voor omzetbeheer de omzetprocessen van AI-ondersteunde workflows naar volledig gecontroleerde, autonome uitvoering met meer dan 50 speciaal ontwikkelde agents die werken met contracten, facturen en beta...
-
InterSystems als Leader im Gartner® Magic Quadrant™ für Enterprise Electronic Health Records ausgezeichnet
BOSTON--(BUSINESS WIRE)--InterSystems, ein innovativer Anbieter von Datentechnologie, dessen Lösungen weltweit mehr als eine Milliarde Patientenakten unterstützen, gab heute bekannt, dass das Unternehmen im Gartner Magic Quadrant 2026 für Enterprise Electronic Health Records (EHR) 2026 als Leader eingestuft wurde. Ein Gartner Magic Quadrant bietet einen Überblick über einen bestimmten Markt und ordnet die wichtigsten Anbieter im Wettbewerbsumfeld ein. Durch die grafische Darstellung und ein ein...
