Newsroom
Sorted by: Latest
-
Kaleon S.p.A. : L’Assemblée Générale des actionnaires approuve le plan 2026-2028 d'attribution d'actions
MILAN--(BUSINESS WIRE)--Regulatory News: Kaleon S.p.A (« Kaleon » ou la « Société ») (Paris:ALKLN) (MIL:KLN), une société liée à la famille Borromeo, spécialisée dans la gestion et la valorisation touristique du patrimoine artistique, naturel et culturel, annonce que l’Assemblée Générale Ordinaire des actionnaires s’est tenue aujourd’hui et a décidé d’adopter le plan d’incitation fondé sur les actions ordinaires de la Société, dénommé « Plan d’attribution d’actions 2026-2028 », réservé aux dire...

-
Deutsche Bank AG UK Regulatory Announcement: FRN Variable Rate Fix
LONDON--(BUSINESS WIRE)-- Penarth Master Issuer PLC GBP 120,000,000.00 Class C Asset Backed Floating Rate Notes Due 10/2023 ISSUE NAME. Our Ref. MI6460 ISIN Code. XS1117709649 TOTAL INTEREST AMT. CURRENCY CODE. GBP DAY BASIS. ACTUAL/365 FIXED (A005) NUM OF DAYS. 32 INTEREST RATE. 5.73572 PCT VALUE DATE. 20/07/2026 INTEREST PERIOD. 18/06/2026 TO 20/07/2026 GBP 603,429.17 POOL FACTOR. N/A...
-
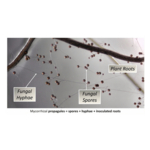
Syngenta and Groundwork BioAg Enter Partnership to Bring Innovation in Biologicals and Soil Carbon Solutions to Farmers
BASEL, Switzerland--(BUSINESS WIRE)--Syngenta and Groundwork BioAg today announced a strategic partnership to market Groundwork's mycorrhizal technology. Syngenta, the global leader in biological crop protection, now offers a biological solution that enhances crop performance, provides resistance to plant stress while improving soil health with a carbon credit program, generating an additional revenue stream for farmers.Under the partnership, Syngenta will commercialize mycorrhiza-based products...
-
Draig Therapeutics Closes Oversubscribed $65 Million Series B to Accelerate Development of Highly Specific AMPA and GABAA Receptor Modulators in Neuropsychiatric Disorders
NEWTON, Mass., & CARDIFF, United Kingdom--(BUSINESS WIRE)--Draig Therapeutics, a clinical-stage biopharmaceutical company developing transformative, best-in-class neuropsychiatric therapies, today announced the closing of an oversubscribed $65 million Series B financing. The round was led by Deep Track Capital with participation from Janus Henderson Investors, Marshall Wace, British Business Bank and Jefferson Life Sciences. “This oversubscribed financing from an exceptional group of new invest...
-
Deutsche Bank AG UK Regulatory Announcement: FRN Variable Rate Fix
LONDON--(BUSINESS WIRE)-- Penarth Master Issuer PLC GBP 500,000,000.00 Series 2018-2 A2 Class A Asset Backed Floating Rate Note DUE 9/2025 Reg S ISSUE NAME. Our Ref. ML5494 ISIN Code. XS1885682978 TOTAL INTEREST AMT. CURRENCY CODE. GBP DAY BASIS. ACTUAL/365 FIXED (A005) NUM OF DAYS. 32 INTEREST RATE. 4.63572 PCT VALUE DATE. 20/07/2026 INTEREST PERIOD. 18/06/2026 TO 20/07/2026 GBP 2,032,096.44 POOL FACTOR. N/A...
-
International Gaming Leader BOYLE Sports Chooses Jumio to Simplify Player Onboarding Across the UK and Ireland
LONDON--(BUSINESS WIRE)--Jumio, the leading provider of AI-powered identity intelligence, has partnered with BOYLE Sports, Ireland’s largest independently owned bookmaker, to deliver a faster, safer, and more seamless onboarding experience for players across the UK and Ireland. BOYLE Sports is using Jumio’s Identity Verification and Doc Proof solutions to automatically and rapidly verify new players’ identities during onboarding. Jumio’s AI-powered checks enable BOYLE Sports to verify customers...

-
Deutsche Bank AG UK Regulatory Announcement: FRN Variable Rate Fix
LONDON--(BUSINESS WIRE)-- Penarth Master Issuer PLC GBP 600,000,000.00 Class B Asset Backed Floating Rate Notes Due 10/2023 ISSUE NAME. Our Ref. MI6461 ISIN Code. XS1117709219 TOTAL INTEREST AMT. CURRENCY CODE. GBP DAY BASIS. ACTUAL/365 FIXED (A005) NUM OF DAYS. 32 INTEREST RATE. 5.23572 PCT VALUE DATE. 20/07/2026 INTEREST PERIOD. 18/06/2026 TO 20/07/2026 GBP 2,754,132.16 POOL FACTOR. N/A...
-
Pershing Square Holdings, Ltd. UK Regulatory Announcement: Transaction in Own Shares
LONDON--(BUSINESS WIRE)-- Pershing Square Holdings, Ltd. Announces Transactions in Own Shares - 13 July 2026 Pershing Square Holdings, Ltd. (LN:PSH) (LN:PSHD) (“PSH”) today announced that it has purchased, through PSH’s agent, Jefferies International Limited (“Jefferies”), the following number of PSH’s Public Shares of no par value (ISIN Code: GG00BPFJTF46) (the "Shares"): Total Buyback Ticker/s: PSH (LSE); PSHD (LSE) Date of Purchase: 13 July 2026 Number of Public Shares Purchased: 37,675 S...
-
Deutsche Bank AG UK Regulatory Announcement: FRN Variable Rate Fix
LONDON--(BUSINESS WIRE)-- Penarth Master Issuer PLC GBP 500,000,000.00 Class D Asset Backed Floating Rate Notes Due 10/2023 ISSUE NAME. Our Ref. MI6459 ISIN Code. XS1117710142 TOTAL INTEREST AMT. CURRENCY CODE. GBP DAY BASIS. ACTUAL/365 FIXED (A005) NUM OF DAYS. 32 INTEREST RATE. 4.33572 PCT VALUE DATE. 20/07/2026 INTEREST PERIOD. 18/06/2026 TO 20/07/2026 GBP 1,900,589.59 POOL FACTOR. N/A...
-
Zespół Rochester Electronics i Qorvo® oferuje długoterminową dostępność komponentów RF
NEWBURYPORT, Mass.--(BUSINESS WIRE)--Firmy Rochester Electronics LLC, wiodący dostawcą oferujący ciągłą dostępność autoryzowanych układów półprzewodnikowych, oraz Qorvo®, wiodący globalny dostawca rozwiązań w zakresie łączności i zasilania ogłosiły dziś zawarcie ogólnoświatowej umowy dystrybucyjnej z Rochester Electronics LLC, wiodącym dostawcą zapewniającym ciągłą dostępność autoryzowanych układów półprzewodnikowych. Współpraca ta znacznie rozszerza dostępność wysokowydajnych rozwiązań półprze...