Newsroom
Sorted by: Latest
-
A Bacardi teljes tulajdonjogot szerez a TEELING® ír whisky felett
HAMILTON, Bermuda--(BUSINESS WIRE)--A Bacardi Limited bejelentette annak a tranzakciónak a lezárását, amely a családi tulajdonban lévő vállalatot a Teeling Whiskey Company és a TEELING® ír whiskymárka egyedüli tulajdonosává teszi. Az alapítók, Jack és Stephen Teeling továbbra is a márka részesei maradnak, stratégiai tanácsadóként alakítják a jövőjét és hosszú távon támogatják a növekedését. A mai bejelentés a két vállalat közötti, 2017-ben indult sikeres kapcsolatot követi, amikor a Bacardi kis...

-
Samenvatting: Veristat versterkt biostatistiek, advies bij ontwikkeling van geneesmiddelen en peoplemanagement om groei in complexe klinische ontwikkeling te ondersteunen
SOUTHBOROUGH, Mass.--(BUSINESS WIRE)--VeristatTM, een internationale CRO (Clinical Research Organization) en consultancy gespecialiseerd in complexe studies, maakte vandaag vier aanwervingen van strategische kaderleden bekend ter bevordering van zijn missie om de goedkeuring te versnellen van nieuwe therapieën in de domeinen van complexe ziekten, waaronder cel- en gentherapie, oncologie en zeldzame aandoeningen. Verder bouwend op zijn 30-jarige grondslag in biostatistiek en de recente overname...

-
BerryDunn’s 30th Annual EMPOWER Summit Tackles Issues Facing Nonprofits
PORTLAND, Maine--(BUSINESS WIRE)--BerryDunn, a full-service accounting, tax, and consulting firm, will host its annual Nonprofit Summit, EMPOWER, on Wednesday, June 24, 2026. Continuing a 30-year history of providing education for nonprofit leaders, the half-day virtual summit will focus on current industry trends and practical guidance to help leaders in the nonprofit sector confidently navigate an increasingly complex environment. Presenters at this year’s summit will address funding pressure...
-
Riassunto: Veristat rafforza la biostatistica, la consulenza per lo sviluppo dei farmaci e la leadership delle persone per sostenere la crescita nello sviluppo clinico complesso
SOUTHBOROUGH, Mass.--(BUSINESS WIRE)--VeristatTM , organizzazione di ricerca clinica (CRO) internazionale e società di consulenza specializzata in studi complessi, oggi ha annunciato quattro assunzioni strategiche ai vertici aziendali che promuovono la sua missione di accelerare nuove approvazioni terapeutiche nell'ambito di patologie complesse, tra cui citoterapia e terapia genica, oncologia e malattie rare. Grazie alla sua esperienza trentennale nella biostatistica e la sua recente acquisizio...

-
KBRA Assigns Preliminary Ratings to MAPS 2026-2 Trust
NEW YORK--(BUSINESS WIRE)--KBRA assigns preliminary ratings to two classes of notes issued by MAPS 2026-2 Trust (MAPS 2026-2), an aviation ABS transaction. MAPS 2026-2 represents the second aviation ABS transaction serviced by Perseus Asset Management Limited (Perseus, the Servicer, or the Company). It is the fifth aviation lease ABS issued under Apollo’s aviation finance platform, following three prior transactions completed by Merx Aviation (Merx) between 2018 and 2021, and the inaugural tran...
-
Cloudflare y beehiiv presentan controles de rastreo con IA para ayudar a los editores independientes a navegar por la era de la inteligencia artificial
SAN FRANCISCO--(BUSINESS WIRE)--Cloudflare, Inc. (NYSE: NET), empresa líder en conectividad en la nube, y beehiiv, plataforma de publicación especializada en boletines informativos que ayuda a editores y empresas a gestionar, aumentar y monetizar sus audiencias, acaban de anunciar una alianza estratégica para redefinir la economía de los creadores y la forma en que creadores independientes interactúan con la inteligencia artificial. Esta colaboración, que integra la avanzada tecnología Crawl Co...
-
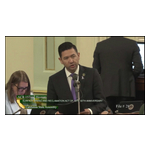
Legislature and CalCIMA Celebrate 50 Years of Surface Mining and Reclamation Act (SMARA) in California
SACRAMENTO, Calif.--(BUSINESS WIRE)--The California State Assembly Monday approved ACR 157, commemorating the 50th anniversary of the Surface Mining and Reclamation Act (SMARA), the landmark for responsible mineral resource development and land reclamation. Authored by Assemblymember Josh Hoover (R-Folsom) with bipartisan support and co-authorship from Assemblymembers Jasmeet Bains (D-Delano), Stephanie Nguyen (D-Elk Grove) and more than 50 other members, the resolution celebrates five decades...
-
Veristat renforce ses activités en biostatistique, de conseil en développement de médicaments et de gestion des ressources humaines afin de soutenir la croissance dans le développement clinique complexe
SOUTHBOROUGH, Massachusetts--(BUSINESS WIRE)--VeristatTM, une organisation mondiale de recherche clinique sous contrat (CRO) et cabinet de conseil spécialisé dans les études complexes, a annoncé aujourd'hui quatre nominations de dirigeants stratégiques qui contribueront à faire avancer sa mission : accélérer les approbations de nouvelles thérapies dans des domaines de maladies complexes, notamment la thérapie cellulaire et génique, l'oncologie et les maladies rares. S'appuyant sur ses 30 années...

-
Bacardi wird alleiniger Eigentümer von TEELING® Irish Whiskey
HAMILTON, Bermuda--(BUSINESS WIRE)--Bacardi Limited hat den Abschluss einer Transaktion bekannt gegeben, durch die das Familienunternehmen zum alleinigen Eigentümer der Teeling Whiskey Company und der irischen Whiskey-Marke TEELING® wird. Die Gründer Jack und Stephen Teeling werden weiterhin Teil der Marke bleiben und ihre Zukunft als strategische Berater mitgestalten sowie das langfristige Wachstum vorantreiben. Die heute erfolgte Bekanntgabe folgt auf die erfolgreiche Zusammenarbeit der beide...

-
Resumen: Veristat refuerza sus áreas de bioestadística, asesoramiento en desarrollo de fármacos y liderazgo de personal para impulsar el crecimiento en el ámbito del desarrollo clínico complejo
SOUTHBOROUGH, Massachusetts--(BUSINESS WIRE)--VeristatTM, una organización internacional de investigación clínica (CRO) y consultora especializada en estudios complejos, ha anunciado hoy cuatro incorporaciones estratégicas a su equipo directivo que contribuirán a su objetivo de acelerar la aprobación de terapias innovadoras en áreas terapéuticas complejas, entre las que se incluyen la terapia celular y génica, la oncología y las enfermedades raras. Aprovechando sus 30 años de experiencia en bio...