Newsroom
Sorted by: Latest
-
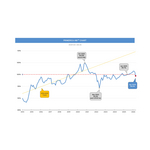
PRIMERICA HOUSEHOLD BUDGET INDEX™ (HBI™): Rising Gas Prices Limit Purchasing Power of Middle-Income Americans in April
DULUTH, Ga.--(BUSINESS WIRE)--The latest Primerica Household Budget Index™ (HBI™) data, a monthly economic metric that examines how inflation and wage trends impact the ability of middle-income families to afford life’s everyday necessities, is estimated at 99.4% in April, down 1.7% from March and 0.3% from a year ago. The decline is driven mainly by increasing gas prices, which rose 11% in the past month and 28% year-over-year. The Consumer Price Index (CPI), which measures inflation for a com...
-
EXIO Group Partners with Solidus Labs to Strengthen Trade Surveillance and AML Compliance
HONG KONG & SINGAPORE--(BUSINESS WIRE)--EXIO Group partnered with Solidus Labs to deploy AI-powered trade surveillance and AML monitoring across its digital asset platform....

-
Mitsubishi Chemical and Accenture Establish Joint Venture to Drive AI-Enabled Business Reinvention and Operational Transformation
TOKYO--(BUSINESS WIRE)--Mitsubishi Chemical Corporation and Accenture have established a joint venture to support the chemical firm’s AI-enabled reinvention....
-
東芝:最大動作温度125°Cに対応した産業用機器向け4チャネル高速スタンダードデジタルアイソレーター発売について
川崎--(BUSINESS WIRE)--(ビジネスワイヤ) -- 東芝デバイス&ストレージ株式会社は、最大動作温度125°Cに対応したSOIC16-Wパッケージの産業用機器向け4チャネル高速スタンダードデジタルアイソレーター「DCL54xx01Aシリーズ」10製品をラインアップに追加しました。本日から量産出荷を開始します。 近年、シリコンカーバイト(SiC)や窒化ガリウム(GaN)などの化合物半導体を用いたパワーデバイスの普及により、産業用機器では高温環境下での動作が一般化しています。一方で、絶縁信号伝送では、入出力間に印加される電気的ノイズによって誤動作が起きるリスクが課題となります。こうした環境下でも、安定した制御信号伝送を実現するため、高い耐ノイズ性と信頼性を両立した絶縁デバイスへの市場要求が高まっています。 新製品は、最大動作温度125°Cに対応しています。さらに、当社独自の磁気結合型絶縁伝送方式[注1]を採用することで、高コモンモード過渡耐性 (CMTI) 150kV/μs (typ.)[注2]を実現し、機器の安定動作に貢献します。 新製品は、順方向4チャネル・逆方向0チ...

-
Energy Vault finalise l’acquisition d’un portefeuille de solutions de stockage d’énergie de 850 MW auprès de BayWa r.e. AG, permettant ainsi la mise en place immédiate d’une plateforme opérationnelle pour tirer parti de la croissance au Japon
WESTLAKE VILLAGE, Californie--(BUSINESS WIRE)--Energy Vault Holdings, Inc. (NYSE : NRGV) (« Energy Vault » ou la « Société »), un chef de file mondial dans le domaine des solutions durables de stockage d’énergie à l’échelle du réseau et des solutions infrastructurelles informatiques basées sur l’intelligence artificielle, a annoncé aujourd’hui la finalisation de l’acquisition, précédemment annoncée, d’un portefeuille de projets de développement de systèmes de stockage d’énergie par batterie (Ba...
-
Edgecore (an Accton Company) and Partners Unite at Computex 2026: Powering the All-Photonics AI Era Together
TAIPEI, Taiwan--(BUSINESS WIRE)--As artificial intelligence reshapes every sector of the global economy, the networks and data centers that power it face a reckoning. Heat is the enemy. Latency is the bottleneck. Proprietary lock-in is the tax. At Computex 2026, Edgecore (an Accton Company) is answering all three challenges at once, with light. The two companies today announced the Edgecore Open Fabric: Built for IOWN®, a next-generation, all-photonics network architecture purpose-built for the...
-
Toshiba Launches Quad-Channel High-Speed Standard Digital Isolators with Maximum Operating Temperature of 125°C for Industrial Equipment
KAWASAKI, Japan--(BUSINESS WIRE)--Toshiba’s new quad‑channel high‑speed digital isolators rated to 125°C for industrial use support stable signal transmission with high noise immunity....

-
Riassunto: Energy Vault conclude l'acquisto di un portafoglio di accumulo energetico da 850 MW da parte di BayWa r.e. AG, stabilendo una piattaforma operativa immediata per catturare la crescita in Giappone
WESTLAKE VILLAGE, Calif.--(BUSINESS WIRE)--Energy Vault Holdings, Inc. (NYSE: NRGV) (“Energy Vault” o la “Società”), leader globale nelle soluzioni sostenibili di accumulo di energia su scala di rete e nelle infrastrutture di calcolo basate sull’intelligenza artificiale, ha annunciato oggi la chiusura riuscita della sua acquisizione precedentemente annunciata di un portafoglio di sviluppo di un sistema di accumulo energetico a batteria (“BESS”) da 850 MW in Giappone da BayWa r.e. AG, importante...
-
Samenvatting: Energy Vault rondt overname af van energieopslagportfolio van 850 MW van BayWa r.e. AG, waarmee direct operationeel platform wordt opgericht om groei in Japan te realiseren
WESTLAKE VILLAGE, Calif.--(BUSINESS WIRE)--Energy Vault Holdings, Inc. (NYSE: NRGV) ('Energy Vault' of het 'bedrijf'), een wereldleider in duurzame energieopslag op netwerkschaal en AI-computerinfrastructuuroplossingen, heeft vandaag de succesvolle afronding aangekondigd van de eerder aangekondigde overname van een portfolio van 850 MW aan batterij-energieopslagsystemen ('BESS') in Japan van BayWa r.e. AG, een toonaangevende wereldwijde ontwikkelaar van hernieuwbare energie en onafhankelijke en...
-
Rambus推出支持CUDIMM/CSODIMM完整客户端芯片组,赋能下一代AI PC内存
中国北京--(BUSINESS WIRE)--Rambus 推出完整DDR5客户端芯片组,搭载第二代客户端时钟驱动器(CKD02)、PMIC5120和SPD集线器,可提供高达9600MT/s的突破性性能。...