Newsroom
Sorted by: Latest
-
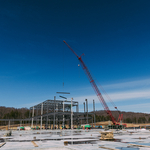
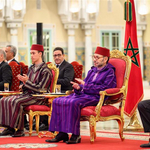
SM le Roi Mohammed VI préside la cérémonie de lancement du projet d'usine de production des trains d’atterrissage représentant un investissement de 280 millions d'euros du groupe Safran au Maroc
CASABLANCA-SETTAT, Morocco--(BUSINESS WIRE)--Sa Majesté le Roi Mohammed VI, que Dieu L’assiste, accompagné de SAR le Prince Héritier Moulay El Hassan, a présidé, vendredi au Palais Royal à Casablanca, la cérémonie de présentation et de lancement du projet de réalisation à Nouaceur d’une usine de production des trains d’atterrissage du groupe Safran, un projet qui conforte le Maroc en tant que destination de choix et véritable acteur industriel intégré au cœur de l’économie mondiale. Considéré c...

-
スルタン・ビン・アハメド殿下、中国でファーウェイ研究開発センターおよび上海メディアグループ(SMG)を訪問
上海--(BUSINESS WIRE)--(ビジネスワイヤ) -- シャルジャ首長国の副統治者で、シャルジャ・メディア評議会議長のシェイク・スルタン・ビン・アハメド・ビン・スルタン・アル・カシミ殿下は、中華人民共和国・上海にて、ファーウェイ研究開発センターと上海メディアグループ(SMG)を訪問されました。 殿下は延べ220万平方メートルの敷地に100棟超の建物と研究施設・ラボを備え、3万人以上が勤務する「ファーウェイ・ビレッジ」を視察しました。施設全体のマスタープランに加え、同社の事業戦略と製品開発を支える主要設備を確認。あわせて、最高水準で整備された建物の仕様や、レストラン、カフェ、娯楽施設、休憩エリアなど、従業員向けに提供される幅広いサービスについて説明を受けました。同センターは、鉄道・バス・船・電動自転車などでアクセスしやすい立地となっています。 続いて殿下は研究開発センターを訪問し、同センターの戦略と研究開発の枠組みについて説明を受けました。さらに、さまざまな重要分野を支える技術ソリューションの開発に特化した設備やラボについて理解を深めました。 殿下は、メディア分野を支えるデ...

-
TRISO-X Receives First-Ever Part 70 HALEU Fuel Fabrication License
OAK RIDGE, Tenn.--(BUSINESS WIRE)--TRISO-X, LLC (“TRISO-X” or the “Company”), a subsidiary of X-energy Reactor Company, LLC (“X-energy”) today received a Special Nuclear Material License under 10 CFR Part 70 (“Part 70”) from the U.S. Nuclear Regulatory Commission (“NRC”), enabling TRISO-X to commercially manufacture fuel using high-assay low-enriched uranium (“HALEU”) at its first two commercial facilities (“TX-1” and “TX-2”) under an initial 40-year license. NRC license approval formally estab...
-
KBRA Assigns Preliminary Ratings to WFCM 2026-1250B
NEW YORK--(BUSINESS WIRE)--KBRA announces the assignment of preliminary ratings to seven classes of WFCM 2026-1250B, a CMBS single-borrower securitization. The collateral for the transaction is a $450.0 million non-recourse, first lien mortgage loan. The fixed rate loan has a three-year term and requires monthly interest-only payments that are based on an assumed coupon of 6.50%. The loan is secured by the borrower’s fee simple interest in 1250 Broadway, a 39-story, Class-A, LEED Platinum certi...
-
Sultan bin Ahmed besucht das Huawei-Forschungs- und Entwicklungszentrum und die SMG in China
SHANGHAI--(BUSINESS WIRE)--Seine Hoheit Scheich Sultan bin Ahmed bin Sultan Al Qasimi, stellvertretender Herrscher von Sharjah und Vorsitzender des Sharjah Media Council, besuchte das Huawei-Forschungs- und Entwicklungszentrum und die Shanghai Media Group (SMG) in Shanghai, Volksrepublik China. Seine Hoheit besichtigte das Huawei Village, das sich über 2,2 Millionen Quadratmeter erstreckt und mehr als 100 Gebäude und Labore umfasst, in denen über 30.000 Mitarbeiter beschäftigt sind. Er informie...

-
EPC Announces Strategic GaN Technology Licensing and Second Sourcing Agreement With Renesas
EL SEGUNDO, Calif.--(BUSINESS WIRE)--Efficient Power Conversion (EPC), the world leader in enhancement-mode gallium nitride (eGaN®) power devices, today announced a comprehensive licensing agreement with Renesas Electronics Corporation, a premier global supplier of advanced semiconductor solutions and high-voltage GaN transistors. Under the agreement, Renesas will gain access to EPC’s proven low-voltage eGaN technology and its established supply-chain ecosystem, accelerating the adoption of hig...
-
HM King Mohammed VI Presides Over the Launch Ceremony of the Aircraft Landing Gear Production Plant Project, Representing an Investment of €280 million by the Safran Group in Morocco
CASABLANCA-SETTAT, Morocco--(BUSINESS WIRE)--His Majesty King Mohammed VI, may God assist Him, accompanied by HRH Crown Prince Moulay El Hassan, chaired on Friday at the Royal Palace in Casablanca the presentation and launch ceremony of the project to build a landing gear production factory for Safran in Nouaceur, a project that reinforces Morocco as a destination of choice and a true integrated industrial actor at the heart of the global economy. Considered one of the largest manufacturing cen...
-
Sultan bin Ahmed visita o Centro de P&D da Huawei e a SMG na China
XANGAI--(BUSINESS WIRE)--Sua Alteza Sheikh Sultan bin Ahmed bin Sultan Al Qasimi, vice-governador de Sharjah e presidente do Conselho de Mídia de Sharjah, visitou o Centro de Pesquisa e Desenvolvimento da Huawei e o Shanghai Media Group (SMG) em Xangai, República Popular da China. Sua Alteza visitou a Huawei Village, que se estende por 2,2 milhões de metros quadrados e integra mais de 100 edifícios e laboratórios, empregando mais de 30.000 funcionários. Ele observou o plano diretor da vila e su...

-
PAMT CORP Announces Results for the Fourth Quarter and Year Ended December 31, 2025
TONTITOWN, Ark.--(BUSINESS WIRE)--PAMT CORP (NASDAQ: PAMT) (“we” or the “Company”) today reported a consolidated net loss of $29.3 million, or diluted and basic loss per share of $1.40, for the quarter ended December 31, 2025 and a consolidated net loss of $52.6 million, or diluted and basic loss per share of $2.48, for the year ended December 31, 2025. These results compare to a consolidated net loss of $31.6 million, or diluted and basic loss per share of $1.45, for the quarter ended December...
-
Lisa Detanna Named to Forbes’ Top Women Wealth Advisors
BEVERLY HILLS, Calif.--(BUSINESS WIRE)--Lisa Detanna, Managing Director and Private Wealth Advisor of the Global Wealth Solutions Group at Raymond James, located at 9595 Wilshire Blvd., Suite 801, Beverly Hills, CA 90212, has again been honored on the Forbes 2026 list of America’s Top Women Wealth Advisors, a prestigious ranking developed in partnership with SHOOK® Research. The annual Forbes | SHOOK ranking highlights 100 women across the country who have demonstrated outstanding leadership, c...