

Newsroom
Sorted by: Latest
-
Securities Fraud Investigation Into America's Car-Mart, Inc. (CRMT) Continues – Shareholders Who Lost Money Urged to Contact The Law Offices of Frank R. Cruz
LOS ANGELES--(BUSINESS WIRE)--The Law Offices of Frank R. Cruz continues its investigation of America's Car-Mart, Inc. (“Car-Mart” or the “Company”) (NASDAQ: CRMT) on behalf of investors concerning the Company’s possible violations of federal securities laws.IF YOU ARE AN INVESTOR WHO LOST MONEY ON AMERICA'S CAR-MART, INC. (CRMT), CLICK HERE TO INQUIRE ABOUT POTENTIALLY PURSUING A CLAIM TO RECOVER YOUR LOSS.What Is the Investigation About?On July 15, 2025, Car-Mart disclosed it would delay filin...
-
Footprint erweitert sein Sortiment um PE-freie Becher und bringt damit eine bewährte, recycelbare und im Haushalt kompostierbare Alternative zu mit Kunststoff beschichteten Papierbechern in die Produktion
GILBERT, Arizona--(BUSINESS WIRE)--Footprint, ein auf die Eliminierung von Einwegkunststoffen spezialisiertes Unternehmen im Bereich Materialwissenschaft und -technologie, gab heute bekannt, dass es von Transcend Packaging eine Plattform für recycelbare, im Hauskompost verwertbare und polyethylenfreie (PE-freie) Heiß- und Kaltgetränkebecher sowie Lösungen der nächsten Generation für Papierdeckel und Trinkhalme erworben hat. Transcend Packaging ist ein europäisches Unternehmen, das sich auf Inno...

-
Footprint breidt uit naar PE-vrije bekers en neemt productie van een bewezen, recyclebaar en thuis composteerbaar alternatief voor papieren bekers met plastic coating in gebruik
GILBERT, Ariz.--(BUSINESS WIRE)--Footprint, een bedrijf gespecialiseerd in materiaalwetenschap en -technologie dat zich richt op het uitbannen van plastic voor eenmalig gebruik, heeft vandaag de overname aangekondigd van een platform voor PE-vrije (polyethyleenvrije) bekers voor warme en koude dranken van Transcend Packaging. Ook de bijbehorende innovatieve oplossingen voor papieren deksels en rietjes maken deel uit van de overname. Transcend Packaging is een Europees bedrijf dat zich richt op...
-
Labaton Keller Sucharow LLP Files Securities Class Action Against Primoris Services Corporation
NEW YORK--(BUSINESS WIRE)--Labaton Keller Sucharow LLP (“Labaton”) has filed a securities class action lawsuit (the “Action”) on behalf of its clients Boston Retirement System (“Boston”) and NS Pension Public Equity Fund (“NS Pension”) against Primoris Services Corporation (“Primoris” or the “Company”) (NYSE: PRIM) and certain Primoris officers and directors (collectively, “Defendants”). The Action, which is captioned Boston Retirement System v. Primoris Services Corp., No. 26-cv-02416-B (N.D. T...
-
Footprint amplía su presencia a los vasos sin polietileno y lanza la producción de una alternativa demostrada, reciclable y compostable en el hogar a los vasos de cartón revestidos de plástico
GILBERT, Arizona--(BUSINESS WIRE)--Footprint, una empresa de tecnología y ciencia de materiales que se dedica a eliminar plásticos de un solo uso, anunció hoy la adquisición de una plataforma de vasos para bebidas calientes y frías reciclables, compostables en el hogar y sin polietileno (PE) a Transcend Packaging, junto con soluciones de tapas y sorbetes de cartón de próxima generación. Transcend Packaging es una empresa europea que se dedica a la innovación en soluciones de envasado sostenible...

-
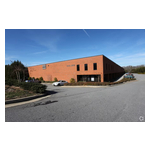
SouthEast Computer Recyclers’ Expansion Deepens Nationwide Footprint as IT Asset Disposition Specialists
ALPHARETTA, Ga.--(BUSINESS WIRE)--SouthEast Computer Recyclers (SECR) has announced an expansion of its services with its new facility at 351 Curie Drive in Alpharetta, Ga. The center broadens SECR’s capabilities as an IT Asset Disposition (ITAD) and e-waste recycling partner, offering enterprise organizations, government agencies, educational institutions, data centers, and end users across the United States a secure, audited path for retiring servers, laptops, hard drives, and other end-of-li...
-
MVST Stockholder Alert: Shareholder Rights Law Firm Robbins LLP Reminds Investors of the Class Action Lawsuit Against Microvast Holdings, Inc.
SAN DIEGO--(BUSINESS WIRE)--Robbins LLP reminds stockholders that a class action was filed on behalf of all investors who purchased or otherwise acquired Microvast Holdings, Inc. (NASDAQ: MVST) securities between April 1, 2025 and March 16, 2026. Microvast purports to design, develop, and manufacture “advanced specialized battery technologies”, primarily for use in electric commercial vehicles and energy storage systems (“ESS”). For more information, submit a form, email attorney Aaron Dumas, J...
-
De la creatividad al mundo laboral: la historia de un estudiante que encontró su vocación gracias al diseño gráfico
PALMDALE, California--(BUSINESS WIRE)--Cuando Ozzie Aguilar, gerente de la empresa de diseño gráfico e impresión Titanium Prints, necesitó incorporar un diseñador gráfico, entrevistó a 25 candidatos. Finalmente, eligió a Johnny G., un joven recién graduado que había completado el programa de diseño gráfico de Learn4Life, una red de más de 80 escuelas secundarias públicas chárter. “Me sorprendió que alguien recién egresado de la secundaria estuviera tan bien preparado para desempeñarse como dise...

-
Gesa Credit Union and Willamette Valley Bank Announce Acquisition Agreement
RICHLAND, Wash. & SALEM, Ore.--(BUSINESS WIRE)--Gesa Credit Union and Willamette Valley Bank, together with the bank’s parent company, Oregon Bancorp, Inc., today announced a definitive agreement for Gesa to acquire the Salem-based community bank, bringing two community-first institutions together to do more for the Willamette Valley than either could alone. Under the agreement, Gesa would acquire substantially all of Willamette Valley Bank’s assets and assume substantially all of its liabiliti...
-
Best’s Market Segment Report: AM Best Maintains Stable Outlook on South Korea’s Non-Life Insurance Market
HONG KONG--(BUSINESS WIRE)--AM Best has maintained its stable outlook on South Korea’s non-life insurance segment, supported by enhanced regulatory frameworks and solid investment performance.According to the Best’s Market Segment Report, “Market Segment Outlook: South Korea Non-Life Insurance,” the country’s regulatory environment supports the stable outlook as regulatory changes are strengthening capital quality, solvency resilience and consistency in IFRS 17 reporting. The introduction of the...